Maps have a long history and remain a staple in our daily lives—to navigate on road trips or understand proximity of one location to another. Until recently, maps were static and printed, which limited the potential for business use cases. With technology advancements, content on maps and the maps themselves became digital, interactive, and more appealing as they’re incorporated in data analysis and reporting. Seeing location data mapped and included in visualizations has both enhanced understanding by more audiences and offered a valuable, new context. Several best-in-class interactive maps exist, but these ten notable examples cover different topics, span the globe, and demonstrate the power of location data when paired with business intelligence.
1. The invisible heartbeat of New York City

Visualization by: Justin Fung Manhattan is the densest area in the U.S., and one of the densest in the world. This stems from having two million residents, but is also influenced by the additional two million people who pour into the city during workdays. An interactive map by data viz designer and researcher Justin Fung shows the mini-migration during a single day using data from the 2010 Census, the MTA’s turnstile database, and a previous NYU study. Justin created block-by-block estimates for Manhattan’s population, which were reflected in the map’s depiction of hourly changes throughout the week. The bars, looking like skyscrapers, reveal the population of a specific block and dark-red colors indicate denser population in Midtown, the Financial District, and other areas.
2. Public holidays

Visualization by: Alexander Waleczek If you need a reason to celebrate today, this map has you covered. In this former “Viz of the Week” from the Tableau Public gallery, Alexander Waleczek analyzed public holidays around the world and developed a map showing where a different holiday is held each day during the year. Select one of the bars to see which countries celebrate that holiday or you can select a country on the map to see which holidays they celebrate, as it filters the bars that spread from the center.
3. U.S. electricity sources
 Visualization by: Simon Evans and Rosamund Pierce When turning on a light, you don’t necessarily think about the power source behind it. This interactive, colorful map details exactly where the United States’ electricity comes from and how much energy is generated. Each circle represents an individual power source, which are color-coded by type, with the source key demonstrating total capacity nationwide. The circle size also indicates the power output generated by the source.
4. U.S. workers at or below minimum wage
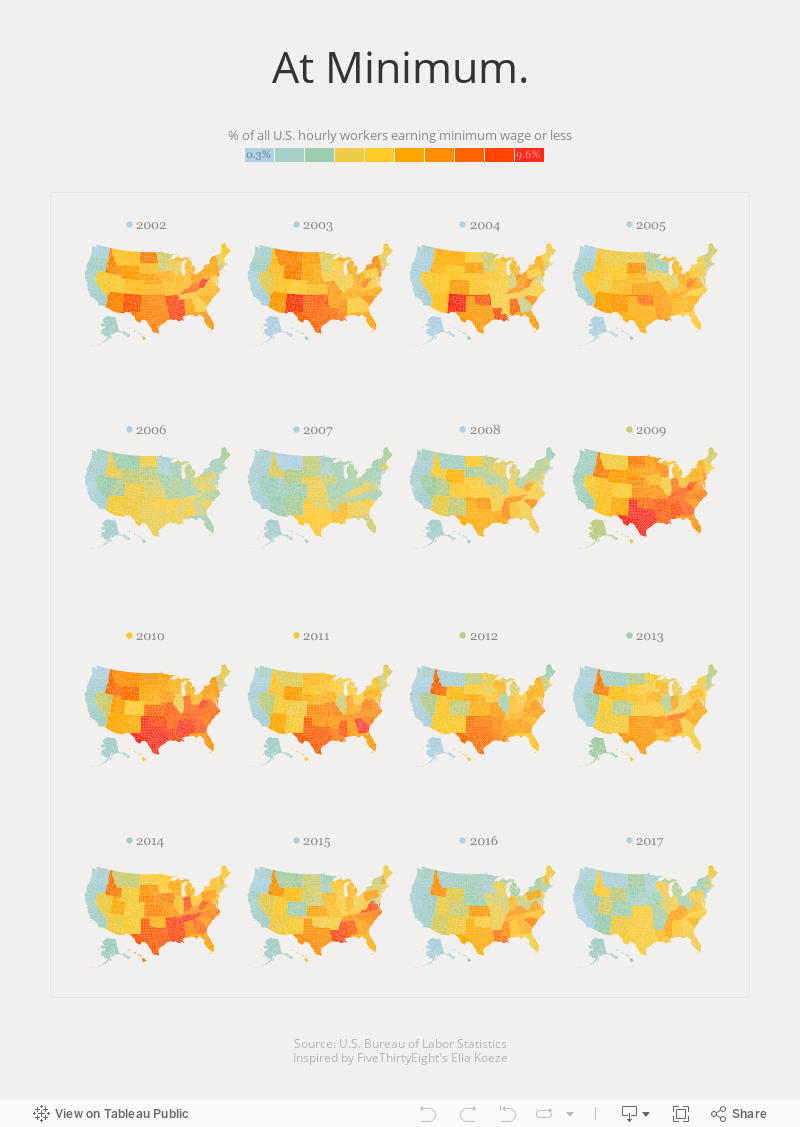
Visualization by: Justin Davis Using data from the U.S. Bureau of Labor Statistics, another Tableau Public “Viz of the Week” by Justin Davis, demonstrates the percentage of all US hourly workers that earn minimum wage or less. Each map in the set of small multiples provides a yearly snapshot of minimum wage workers going as far back as 2002. When you hover over a state, the percentage of workers for that area is noted and looking year-by-year, state-by-state you can see if there is an upward or downward trend.
Create beautiful visualizations with your data.

5. 2018 FIFA World Cup ratings
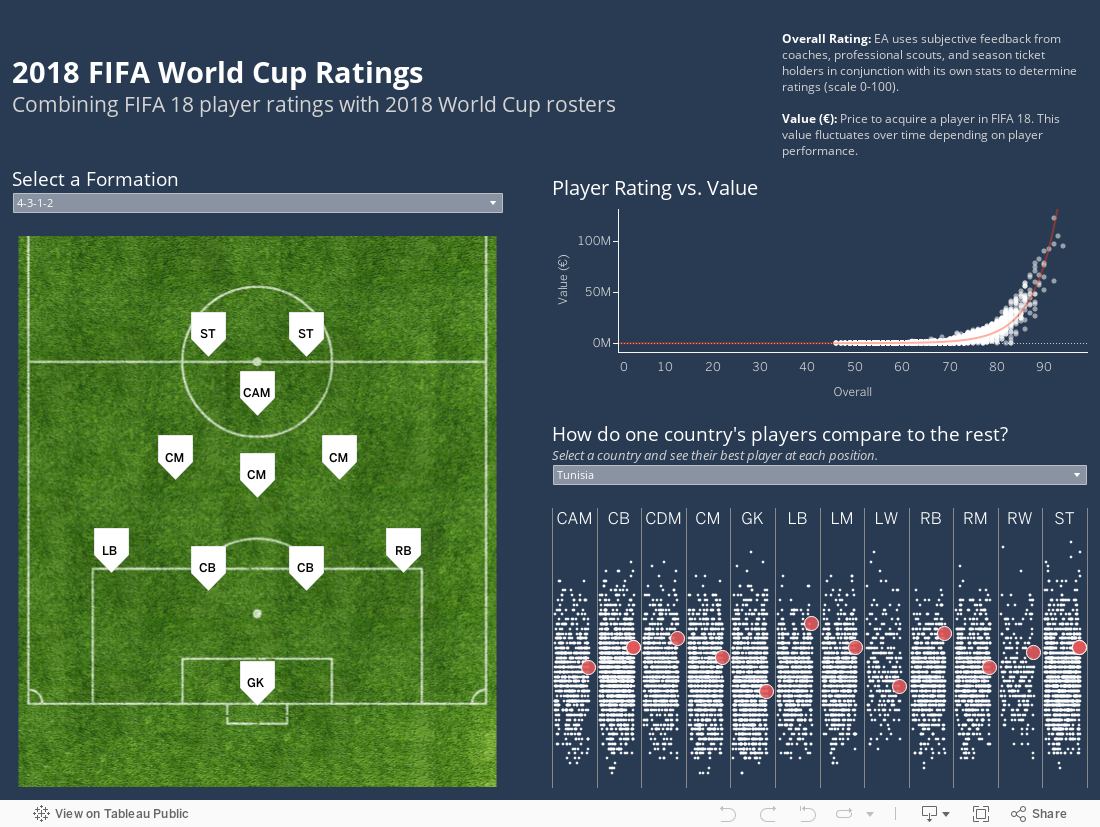
Visualization by: Scott Teal Not all location data must be plotted on maps. Comparing this information on an XY axis and visualized in another format such as heat maps is becoming popular. This visualization is a blend of teams and players in the 2018 World Cup tournament, combined with player ratings from FIFA 18. If you’re a soccer fan, it’s a helpful way to see how players at each position stack up to their competitors. When large volumes of complex statistical data need to be made comprehensible, heatmaps can be effective and you’ll often see them used in sports analytics.
6. Languages in the world
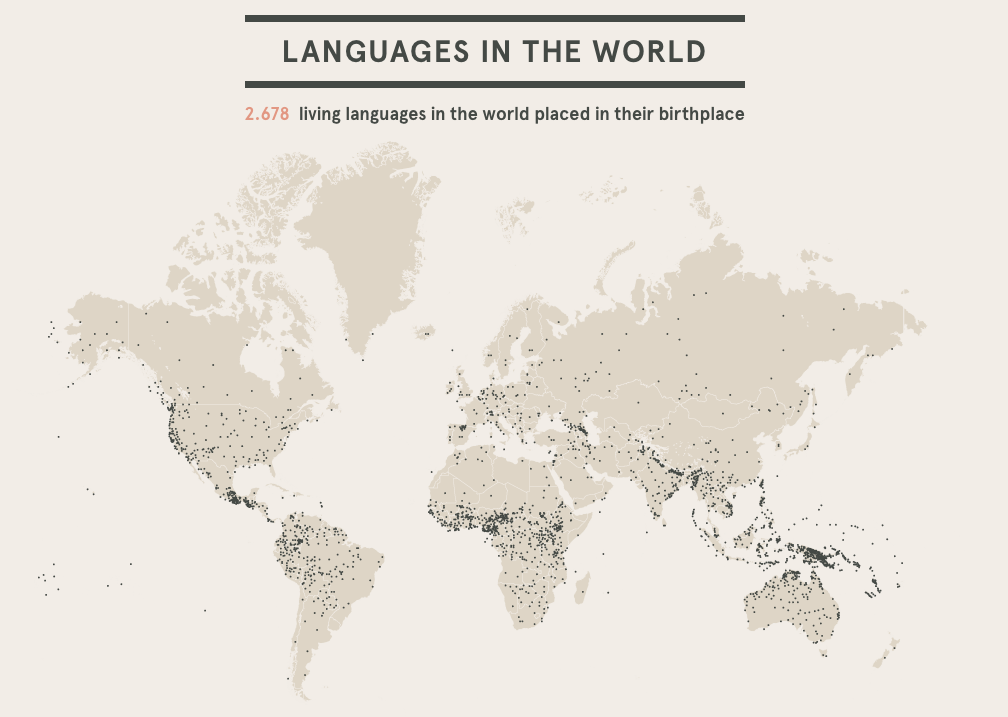 Visualization by: Density Design Lab Did you know there are 2,678 living languages in the world? In Density Design Lab’s “After Babylon,” you can see the world’s languages in a collection of interactive maps and graphs that use the World Atlas of Language Structures to show where a language originates, where it’s spoken, and how much of the world’s population speaks it. Besides revealing other interesting facts such as the 10 most spoken language families, another visualization created by the Density Design Lab highlights that there are 14,680 exchange words—meaning words donated and received between languages.
7. Country-to-country net migration
 Visualization by: Max Galka This animated visualization shows the estimated net immigration between global countries from 2010 to 2015. Hover over the circles to see the net immigration totals—blue circles have positive net migrations with people coming and red circles are negative with people leaving. Clicking on data points will filter immigration in or out of a specific country. If you’re interested in analysis, the author even reviews immigration data points with respect to current news.
8. Star Mapper
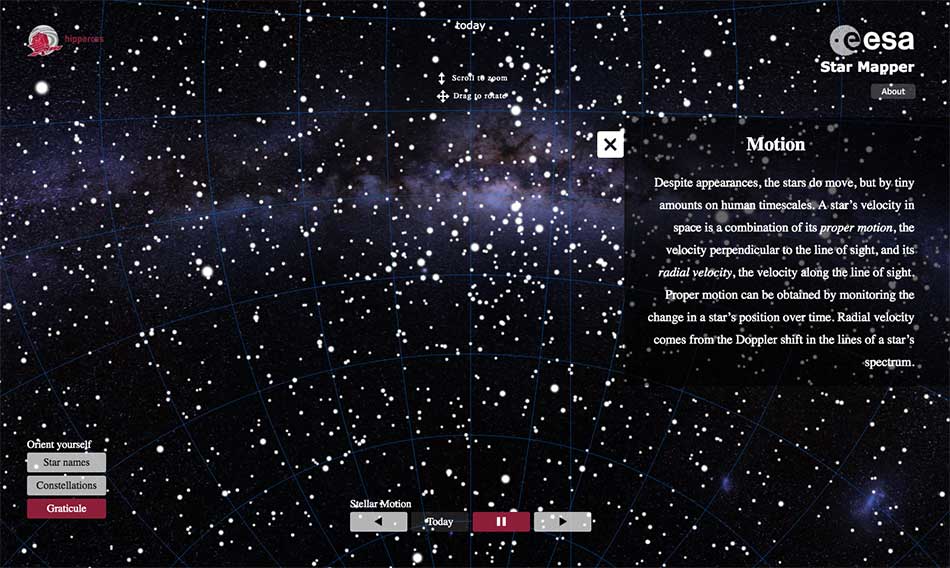 Visualization by: Jan Willem Tulp This map is a stunning visualization of data generated from the European Space Agency’s Hipparcos catalogue. The map shows 59,921 stars and you can pan to explore the night sky. There are five sections that change what data you see and how the visualization appears, depending on different scientific values. You can explore the starry map by dragging and scrolling around and filters turn the star names or constellations on and off. This was created from two images recorded in 2007 and 2008—one of the northern hemisphere from the Canary Islands and the other of the southern hemisphere from Chile. Several planets passed through view during the recording, including Jupiter, which is noted as a bright blue dot on the map.
9. Every upcoming solar eclipse (until 2080)
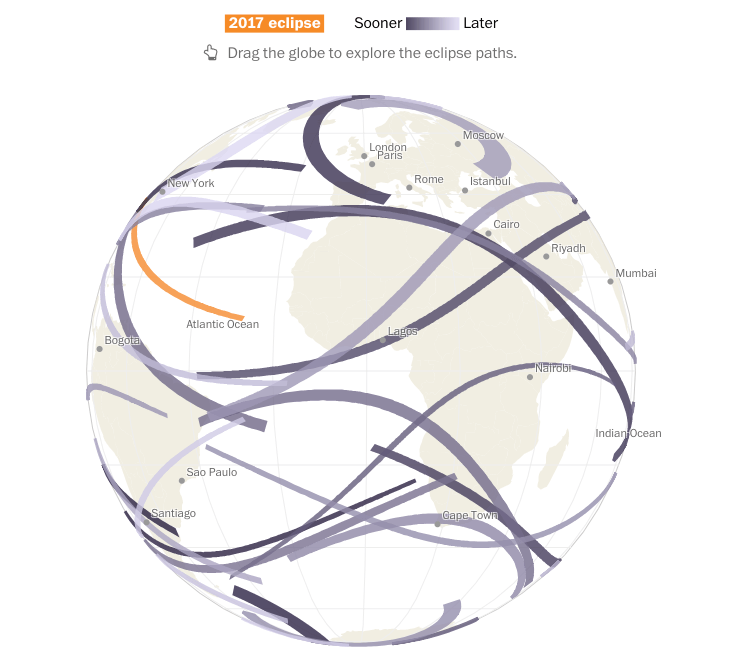 Visualization by: Denise Lu Nearly two years ago, the United States experienced its first eclipse to travel coast-to-coast in almost a century. The Washington Post created an interactive globe and the data was also visualized in Tableau showing the eclipse path along with the paths for eclipses in the next 60 years. Put in your birth year to see how many eclipses remain in your lifetime and where the majority will land, so you can pack your bags and check out a few.
10. Graffiti around the world

Visualization by: Andre Oliveira Art is a global medium. This fantastic worldwide roadmap of Banksy's graffiti lets viewers see his work in certain cities, uncovering where it’s located and offering a picture with the story of how that specific image came to be. The dashboard uses a base map with custom labeling and color coordination between the map and data that helps bring the visualization to life.
Read more about interactive maps
If you find yourself creating data visualizations and debating whether or not there’s an opportunity to use maps, check out this whitepaper that shares helpful tips for improving the analytic and aesthetic value of dashboards with maps. Also ask yourself: could you answer your question faster or easier with another type of data visualization? If the answer is yes, then perhaps a map view is not the best visualization. If the answer is no, then take the following into account: maps add value by bringing data into the context of real life.