Tableau Community icon

Community Projects

Skill-based challenges designed by the community, for the community.

Tableau Public Ambassadors
Tableau users working together

Learn and build your skills with peers around the world.

Members of the Tableau Community create and lead projects that give you the opportunity to learn, practice, and apply your data skills across a variety of topics, products, and causes. Anyone can participate in these projects—including you!


TableaPublicCE

Powered by Tableau Public

Tableau Public is the backbone of our community-led projects. This free platform to explore, create and publicly share data visualizations online is also the largest repository of data visualizations in the world. Utilize it to advance your career in analytics by learning from limitless data inspiration and creating an online portfolio of work.

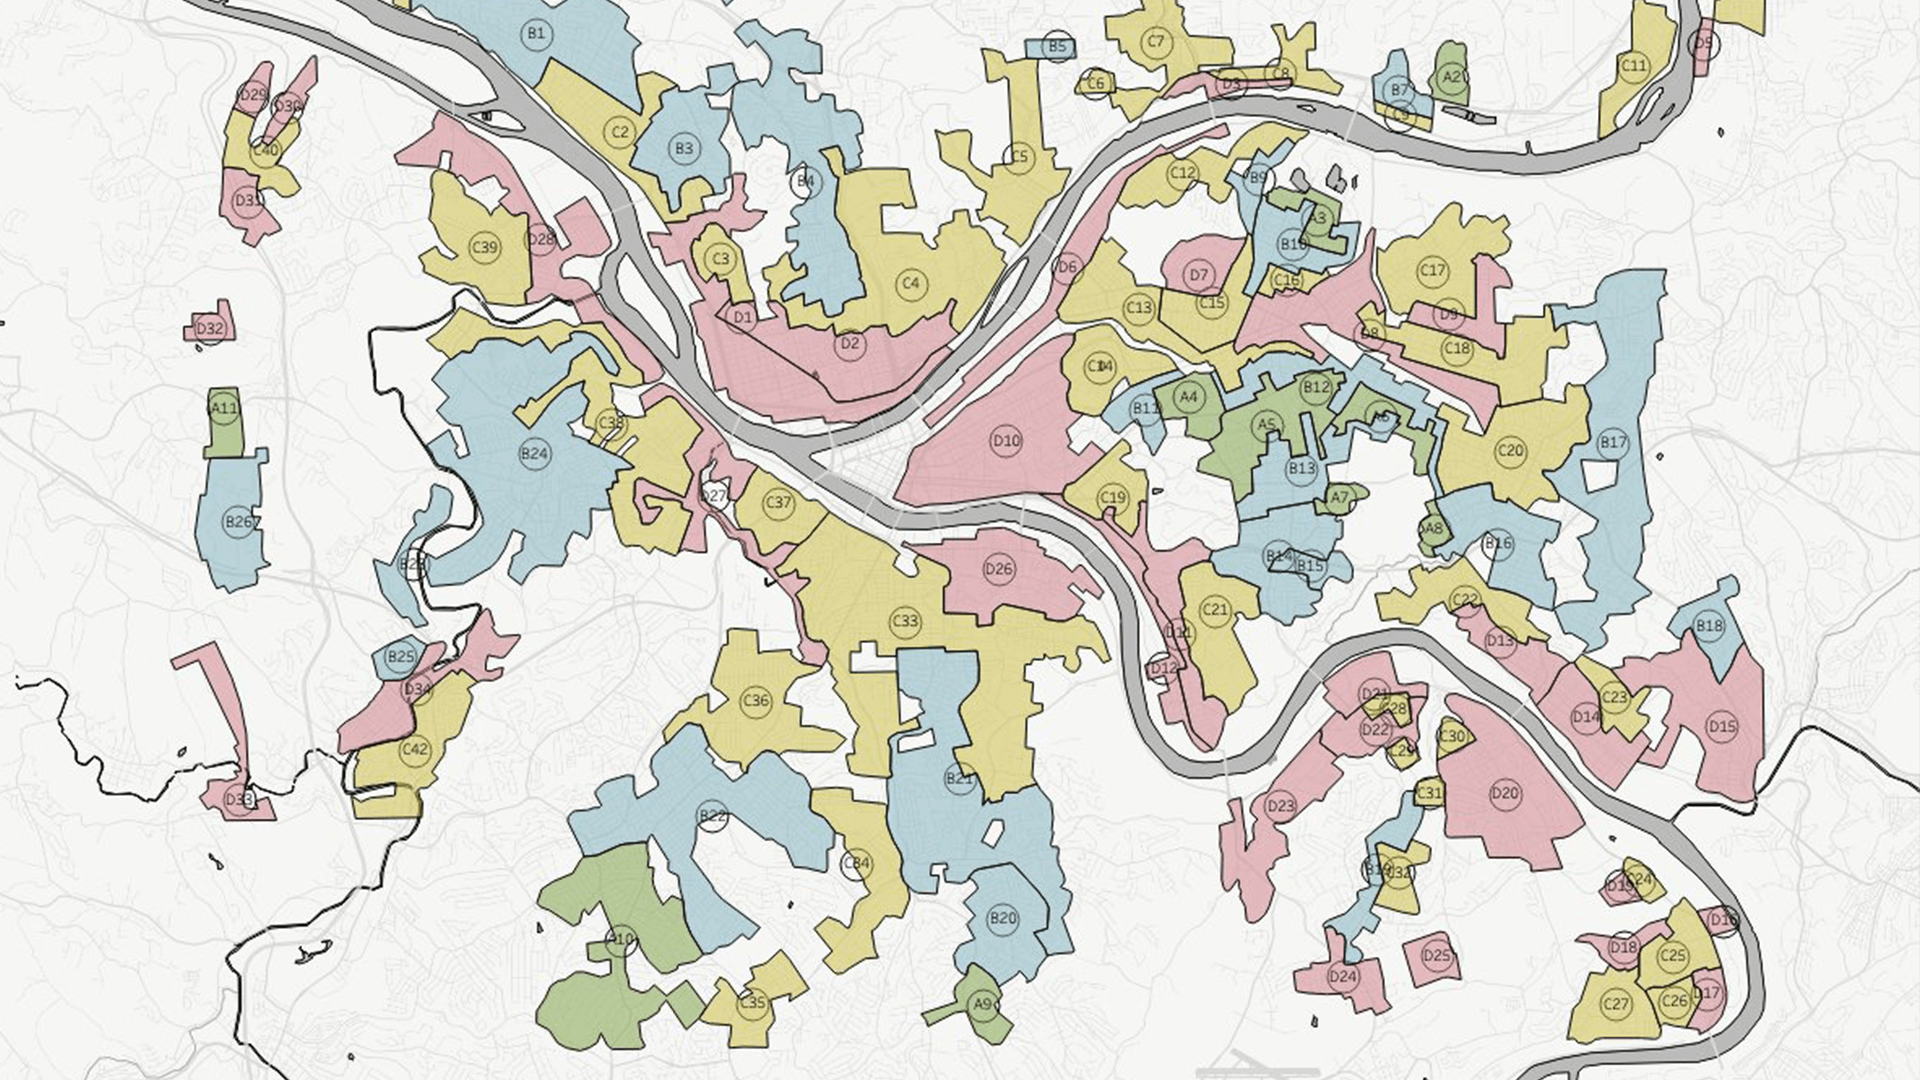
Community projects provide an incredible platform for everyone to practice or experiment with their skills as per their area of interest.

Makeover Monday Opens in a new window.

Access 300 datasets and create better, more effective visualizations. #MakeoverMonday Opens twitter in a new window.

Workout Wednesday Opens in a new window.

Build your skills with a weekly challenge to re-create an interactive data visualization. #WOW2023Opens twitter in a new window.

Viz for Social Good Opens in a new window.

Volunteer to design data visualizations that help nonprofits harness the power of data for social change. #VizforSocialGood Opens twitter in a new window.

Sports Viz Sunday Opens in a new window.

Create and share data visualizations using rich, sports-themed data sets in a monthly challenge. #SportsVizSunday Opens twitter in a new window.

Iron Quest Opens in a new window.

Practice data sourcing, preparation, and visualization skills in a themed monthly challenge. #IronQuest Opens twitter in a new window.

Storytelling with Data Opens in a new window.

Practice data visualization and storytelling skills by participating in monthly challenges and exercises. #SWDChallenge Opens twiter in a new window.

Project Health Viz Opens in a new window.

Uncover new stories by visualizing healthcare data sets provided each month. #ProjectHealthViz

SDG Viz Project

Visualize data about Sustainable Development Goals provided by the World Health Organization. #TheSDGVizProject Opens twitter in a new window.

Viz 2 Educate Opens in a new window.

Each month, create vizzes on global education syllabus topics as resources for teachers worldwide. #Viz2educate Opens twitter in a new window.

Preppin’ Data Opens in a new window.

A weekly challenge to help you learn to prepare data and use Tableau Prep. #PreppinData Opens twitter in a new window.

Real World Fake Data Opens in a new window

Real World Fake Data

Create business dashboards using provided data sets for various industries and departments. #RWFD Opens twitter in a new window.

Diversity in DataOpens in a new window.

An initiative centered around diversity, equity & awareness by visualizing provided datasets each month. #DiversityinData Opens twitter in a new window.


Back 2 Viz Basics Opens in a new window.

A bi-weekly project helping those who are newer in the community and just starting out with Tableau. #B2VBOpens twitter in a new window.


Games Night Viz
Opens in a new window.

A monthly project focusing on using data from your favorite games. #GamesNightVizOpens twitter in a new window.


Data Plus MusicOpens in a new window.

A monthly data visualization challenge where we visualize the data behind the music we love. #DataPlusMusicOpens twitter in a new window.


DataFam ConOpens in a new window.

A monthly challenge covering pop culture and fandoms. #DataFamConOpens twitter in a new window.


EduVizzers
Opens in a new window.

A monthly project connecting real education data with real people. #EduvizzersOpens twitter in a new window.


PublicPolicyVizOpens in a new window.

An initiative dedicated to bridging the gap between data analytics and policy practitioners. #PublicPolicyVizOpens twitter in a new window.


RomanianDATA TribeOpens in a new window.

A monthly challenge to re-create a visualization using Romanian data. #RomanianDATATribe


Viz-For-Vets
Opens in a new window.

Challenges to increase awareness about veterans advocacy organizations. #VizForVetsOpens twitter in a new window.


Dubois ChallengeOpens in a new window.

An initiative to celebrate W.E.B. Du Bois' data visualization legacy by recreating the visualizations showcased at the 1900 Paris Exposition using modern tools. #DuboisChallengeOpens twitter in a new window.


Data Noodle World Tour opens in a new window

Data Noodle World TourOpens in a new window.

A challenge centered around visualizing noodle life around the world. #data_noodleOpens twitter in a new window.