
Tableau 2023.2
Multi-Row calculations in Tableau Prep, Line Patterns, and more
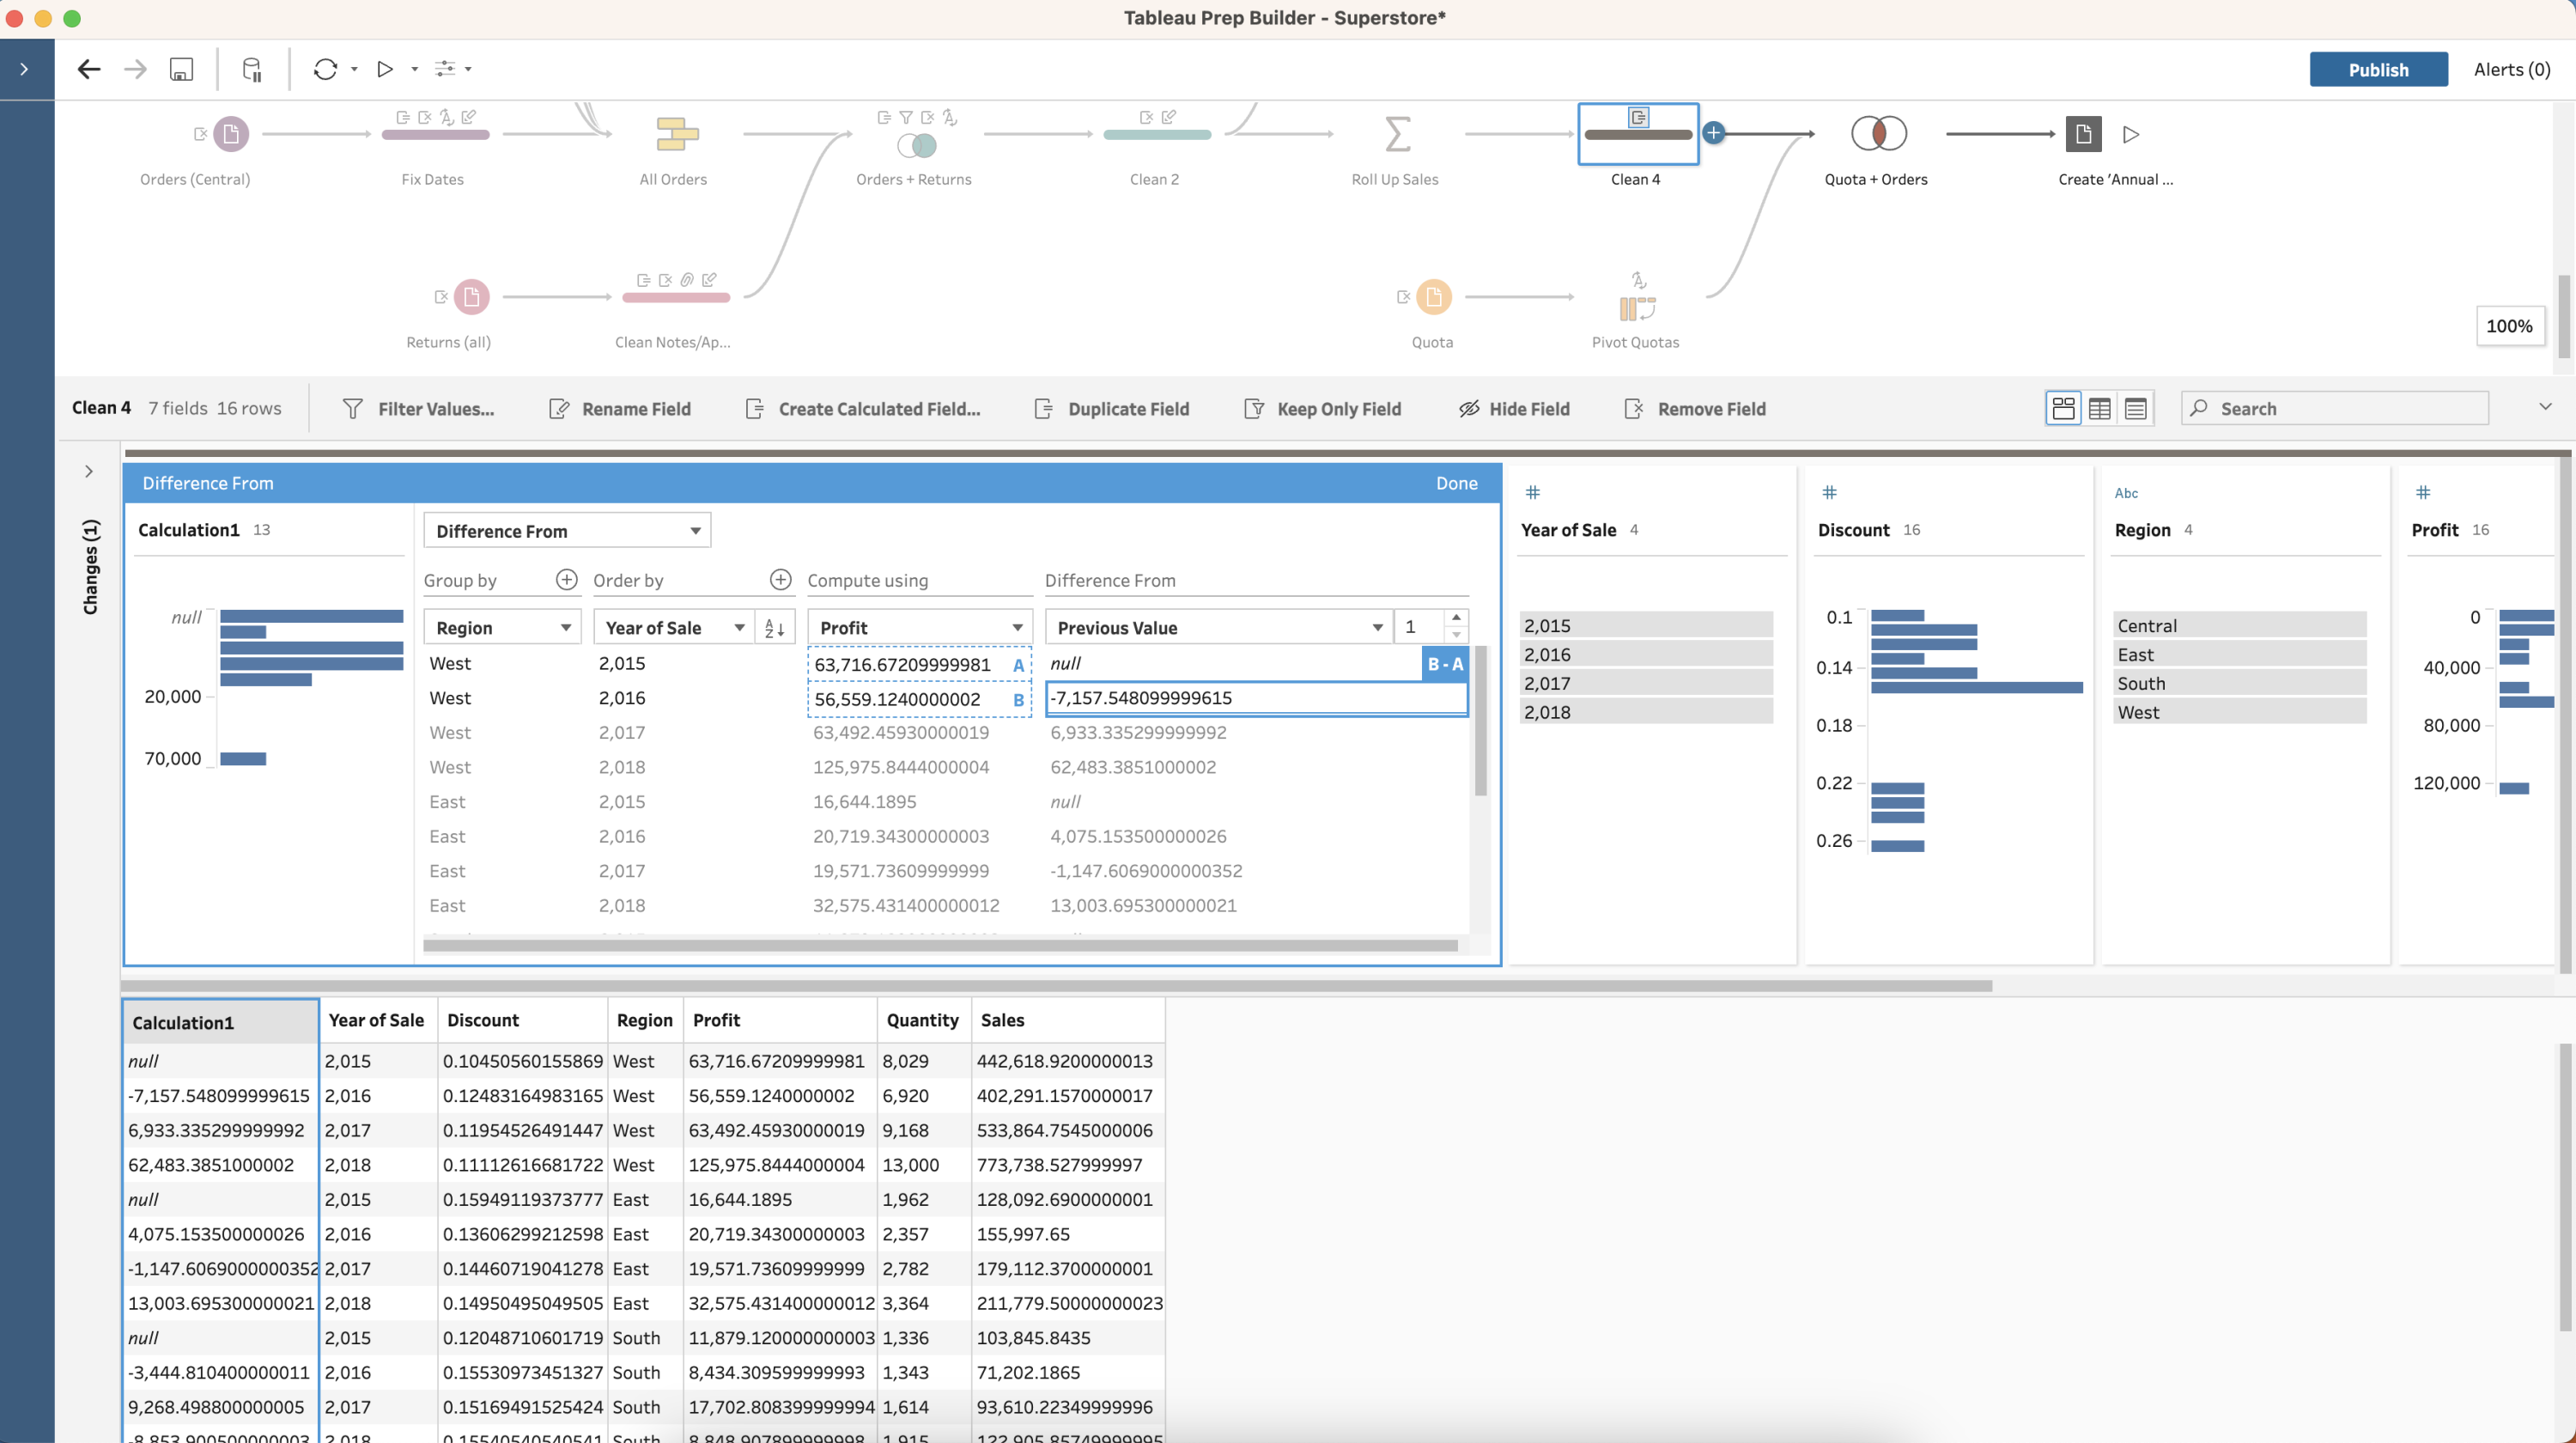
Multi-row calculations in Tableau Prep
With multi-row calculations in Tableau Prep you can compute table calculations while preparing your data. Using clicks, not code or complex calculations, it is easier than ever to calculate difference from, percent difference from, and moving calculations. You can also now write LOOKUP calculations in the expression editor of Tableau Prep.
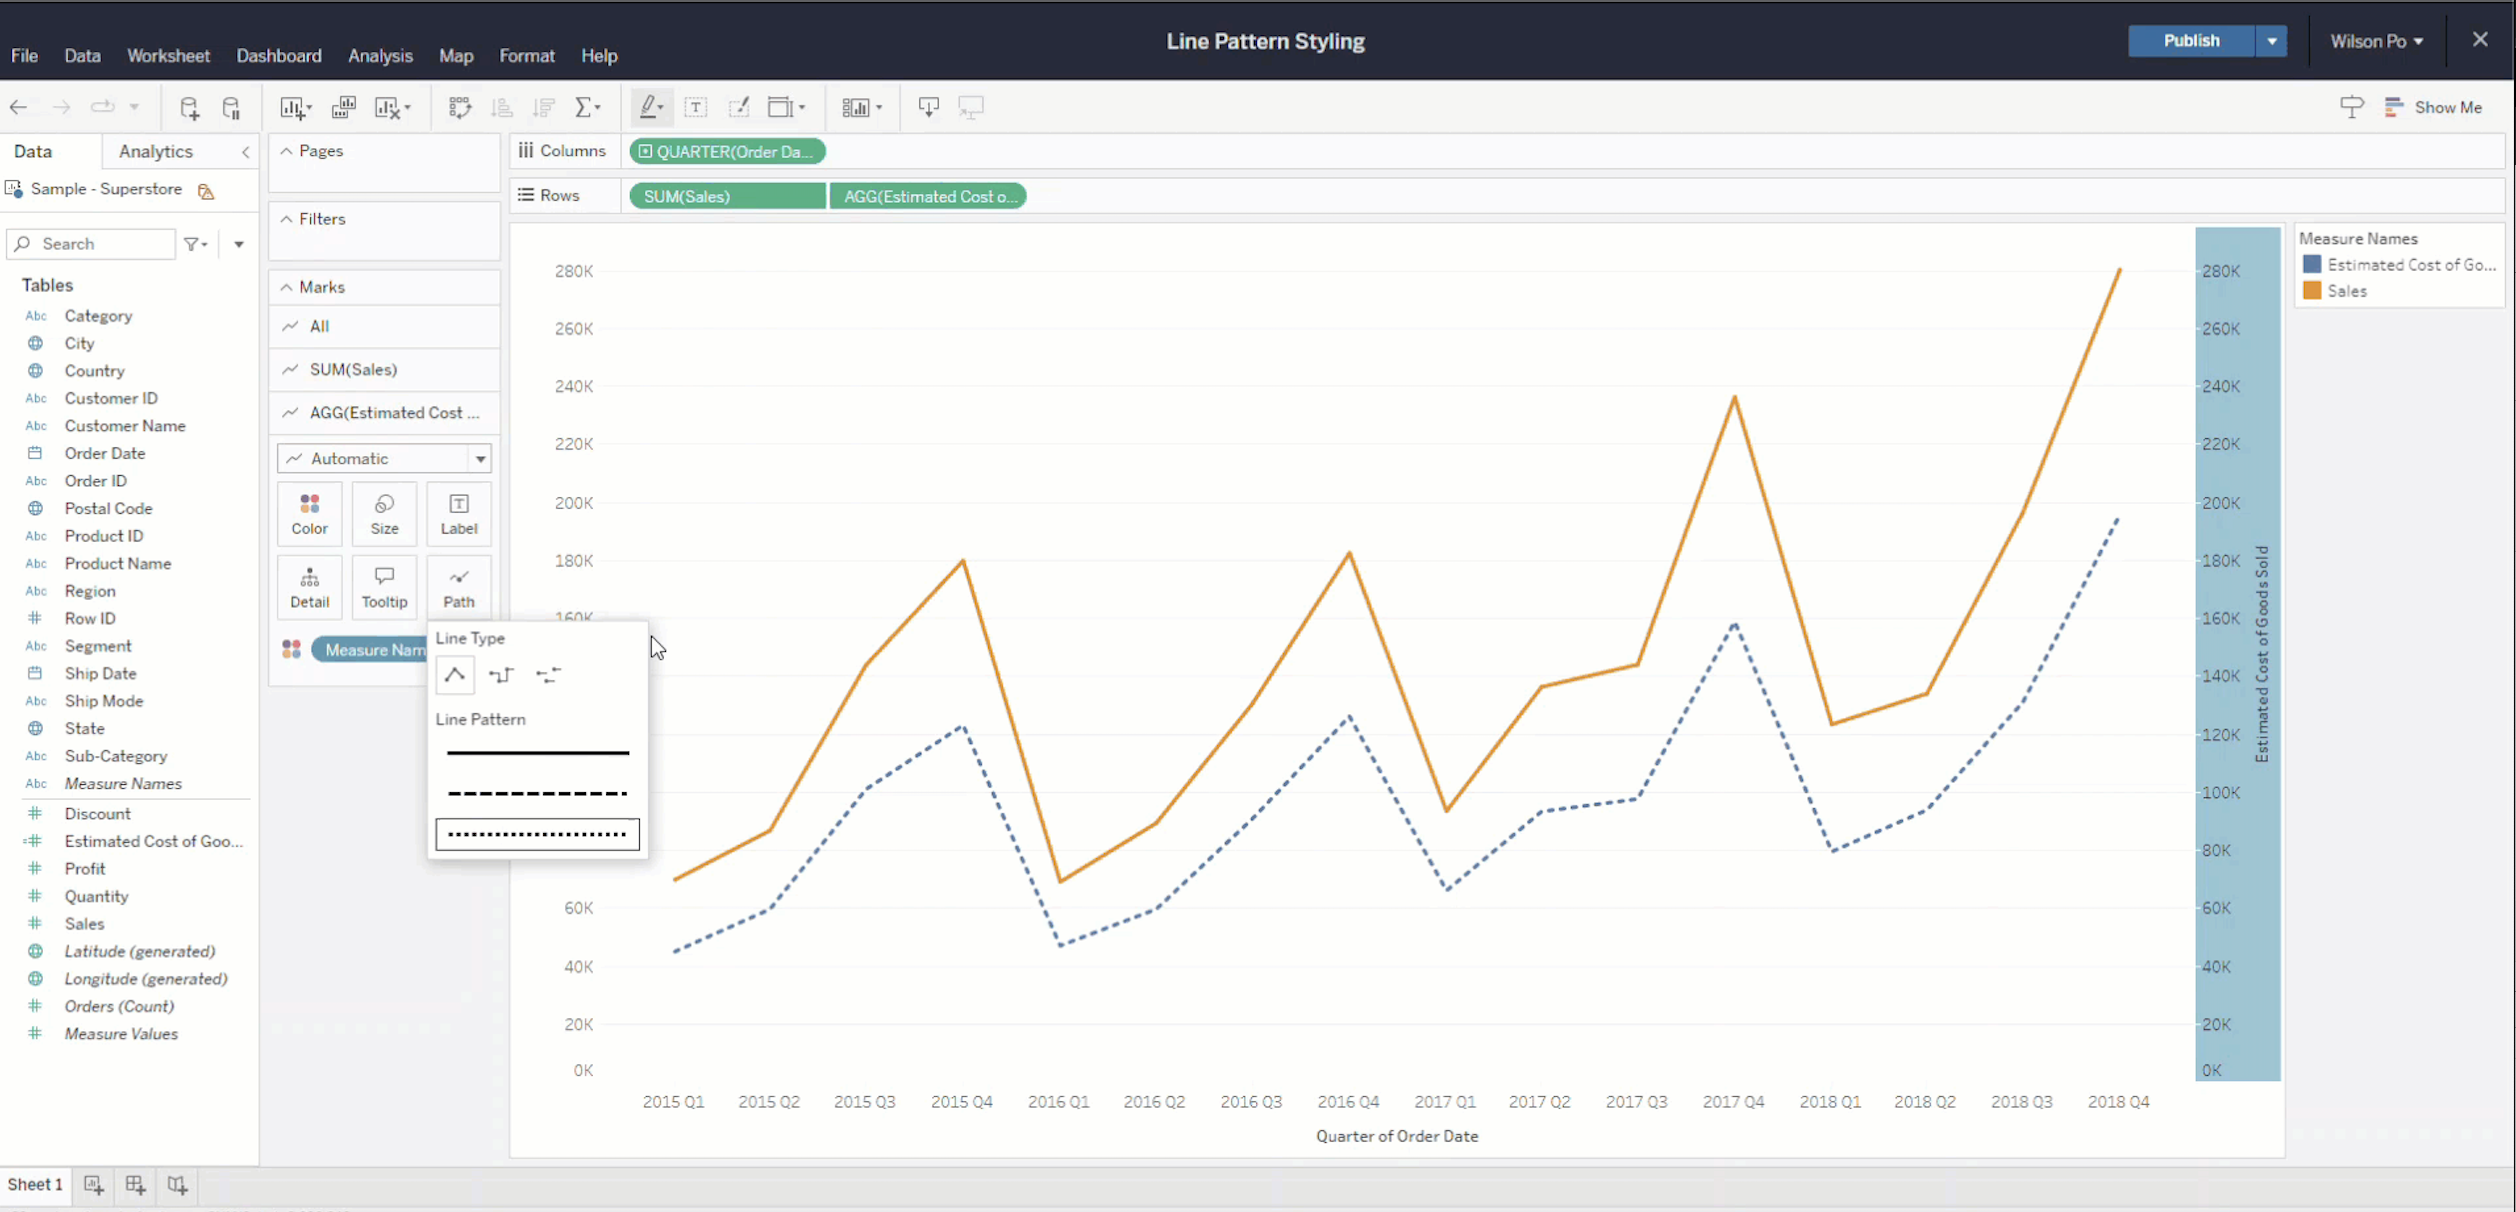
Line Patterns
Line Patterns offer new styling capabilities, allowing an author to select any trend line to be represented as a solid, dashed, or dotted lines. This new capability makes it easier to convey nuance when representing multiple trends, where styling can help to convey when certain lines represent unique context, such as thresholds or modeled data points.
Personal access token admin control
Meet your organizational security requirements with additional control over personal access tokens (PATs) in Tableau Cloud.
Changes for all Tableau Cloud sites include:
- Site admins can now control who has the ability create PATs
- Site admins can now control how long PATs are valid, ranging from 1 to 365 days
Changes for Tableau Cloud sites created after 23.2 include:
- PATs are disabled by default
- Default expiry of PATs shortened to 180 days
All Features
Line Patterns
Line Patterns offer new styling capabilities, allowing an author to select any trend line to be represented as a solid, dashed, or dotted lines. This new capability makes it easier to convey nuance when representing multiple trends, where styling can help to convey when certain lines represent unique context, such as thresholds or modeled data points.
Multi-row calculations in Tableau Prep
With multi-row calculations in Tableau Prep you can compute table calculations while preparing your data. Using clicks, not code or complex calculations, it is easier than ever to calculate difference from, percent difference from, and moving calculations. You can also now write LOOKUP calculations in the expression editor of Tableau Prep.
Personal access token admin control
Meet your organizational security requirements with additional control over personal access tokens (PATs) in Tableau Cloud.
Changes for all Tableau Cloud sites include:
- Site admins can now control who has the ability create PATs
- Site admins can now control how long PATs are valid, ranging from 1 to 365 days
Changes for Tableau Cloud sites created after 23.2 include:
- PATs are disabled by default
- Default expiry of PATs shortened to 180 days
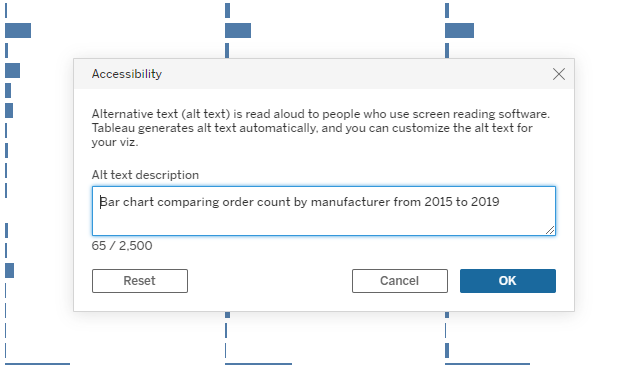
Editable viz alt text
You can now edit automatically generated alt text. By default, Tableau provides automated screen reader text, ensuring there's a description to be announced by screen readers for all online visualizations including client and server side rendered and embedded visualizations. Now, content authors can edit the alt text from either the Data Guide panel or by selecting Accessibility in the Worksheet drop down. Authors can add up to 2500 characters of alt text, providing deep insight into the contents of the visualization.
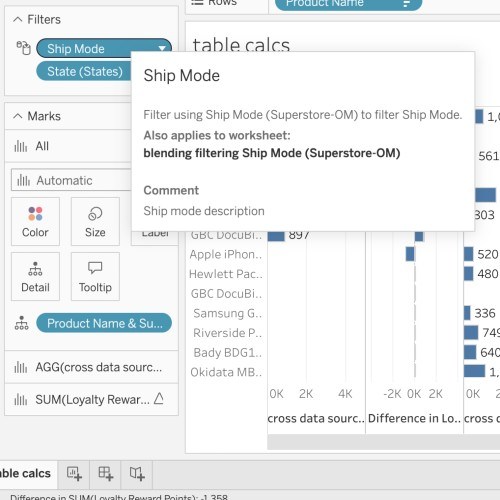
Unified Tooltips
Get more context for your in-shelf pills with new tooltips. Unified Tooltips combine up to six previous tooltips into one that prioritizes information based on relevance. Get the field name, table calc details, and field comments in a single place. Any error messages or filter information now displays in the same tooltip. This unified tooltip is available for pills on all shelves.
Salesforce Data Cloud connector
The Salesforce Data Cloud connector makes it seamless to analyze data from Data Cloud in Tableau. The Data Cloud connector is driver-less, requiring no install, and Data Spaces aware enabling you to create visualizations specific to a Data Space. Data Spaces are logical partitions to organize metadata, data, and processes for relevant stakeholders in Data Cloud. Additionally, the Data Cloud connector shows object label, instead of the object API name, in the Tableau connect UI. This creates a more user-friendly experience when choosing tables to build data sources. The connector also supports an additional 11 functions, including datetime functions, improving your content creation and data analysis processes.
Google Analytics 4 connector
Connect to event data from your Google Analytics 4 property. The Google Analytics 4 connector is available in the Tableau Exchange.
Amazon S3 connector (beta)
With the Amazon S3 connector in beta you can connect to Parquet, CSV, and Excel file data in your Amazon S3 bucket. The new connector is available in Tableau Cloud as well as the Tableau Exchange.

Amazon Athena connector: 3rd party IdP support
Use industry leading 3rd party identity providers such as Azure AD or Okta to manage secure authentication to Amazon Athena data sources. Using the OAuth configuration for an identity provider, you have increased flexibility and security of connections, along with multi-factor authentication, to important data in Athena.
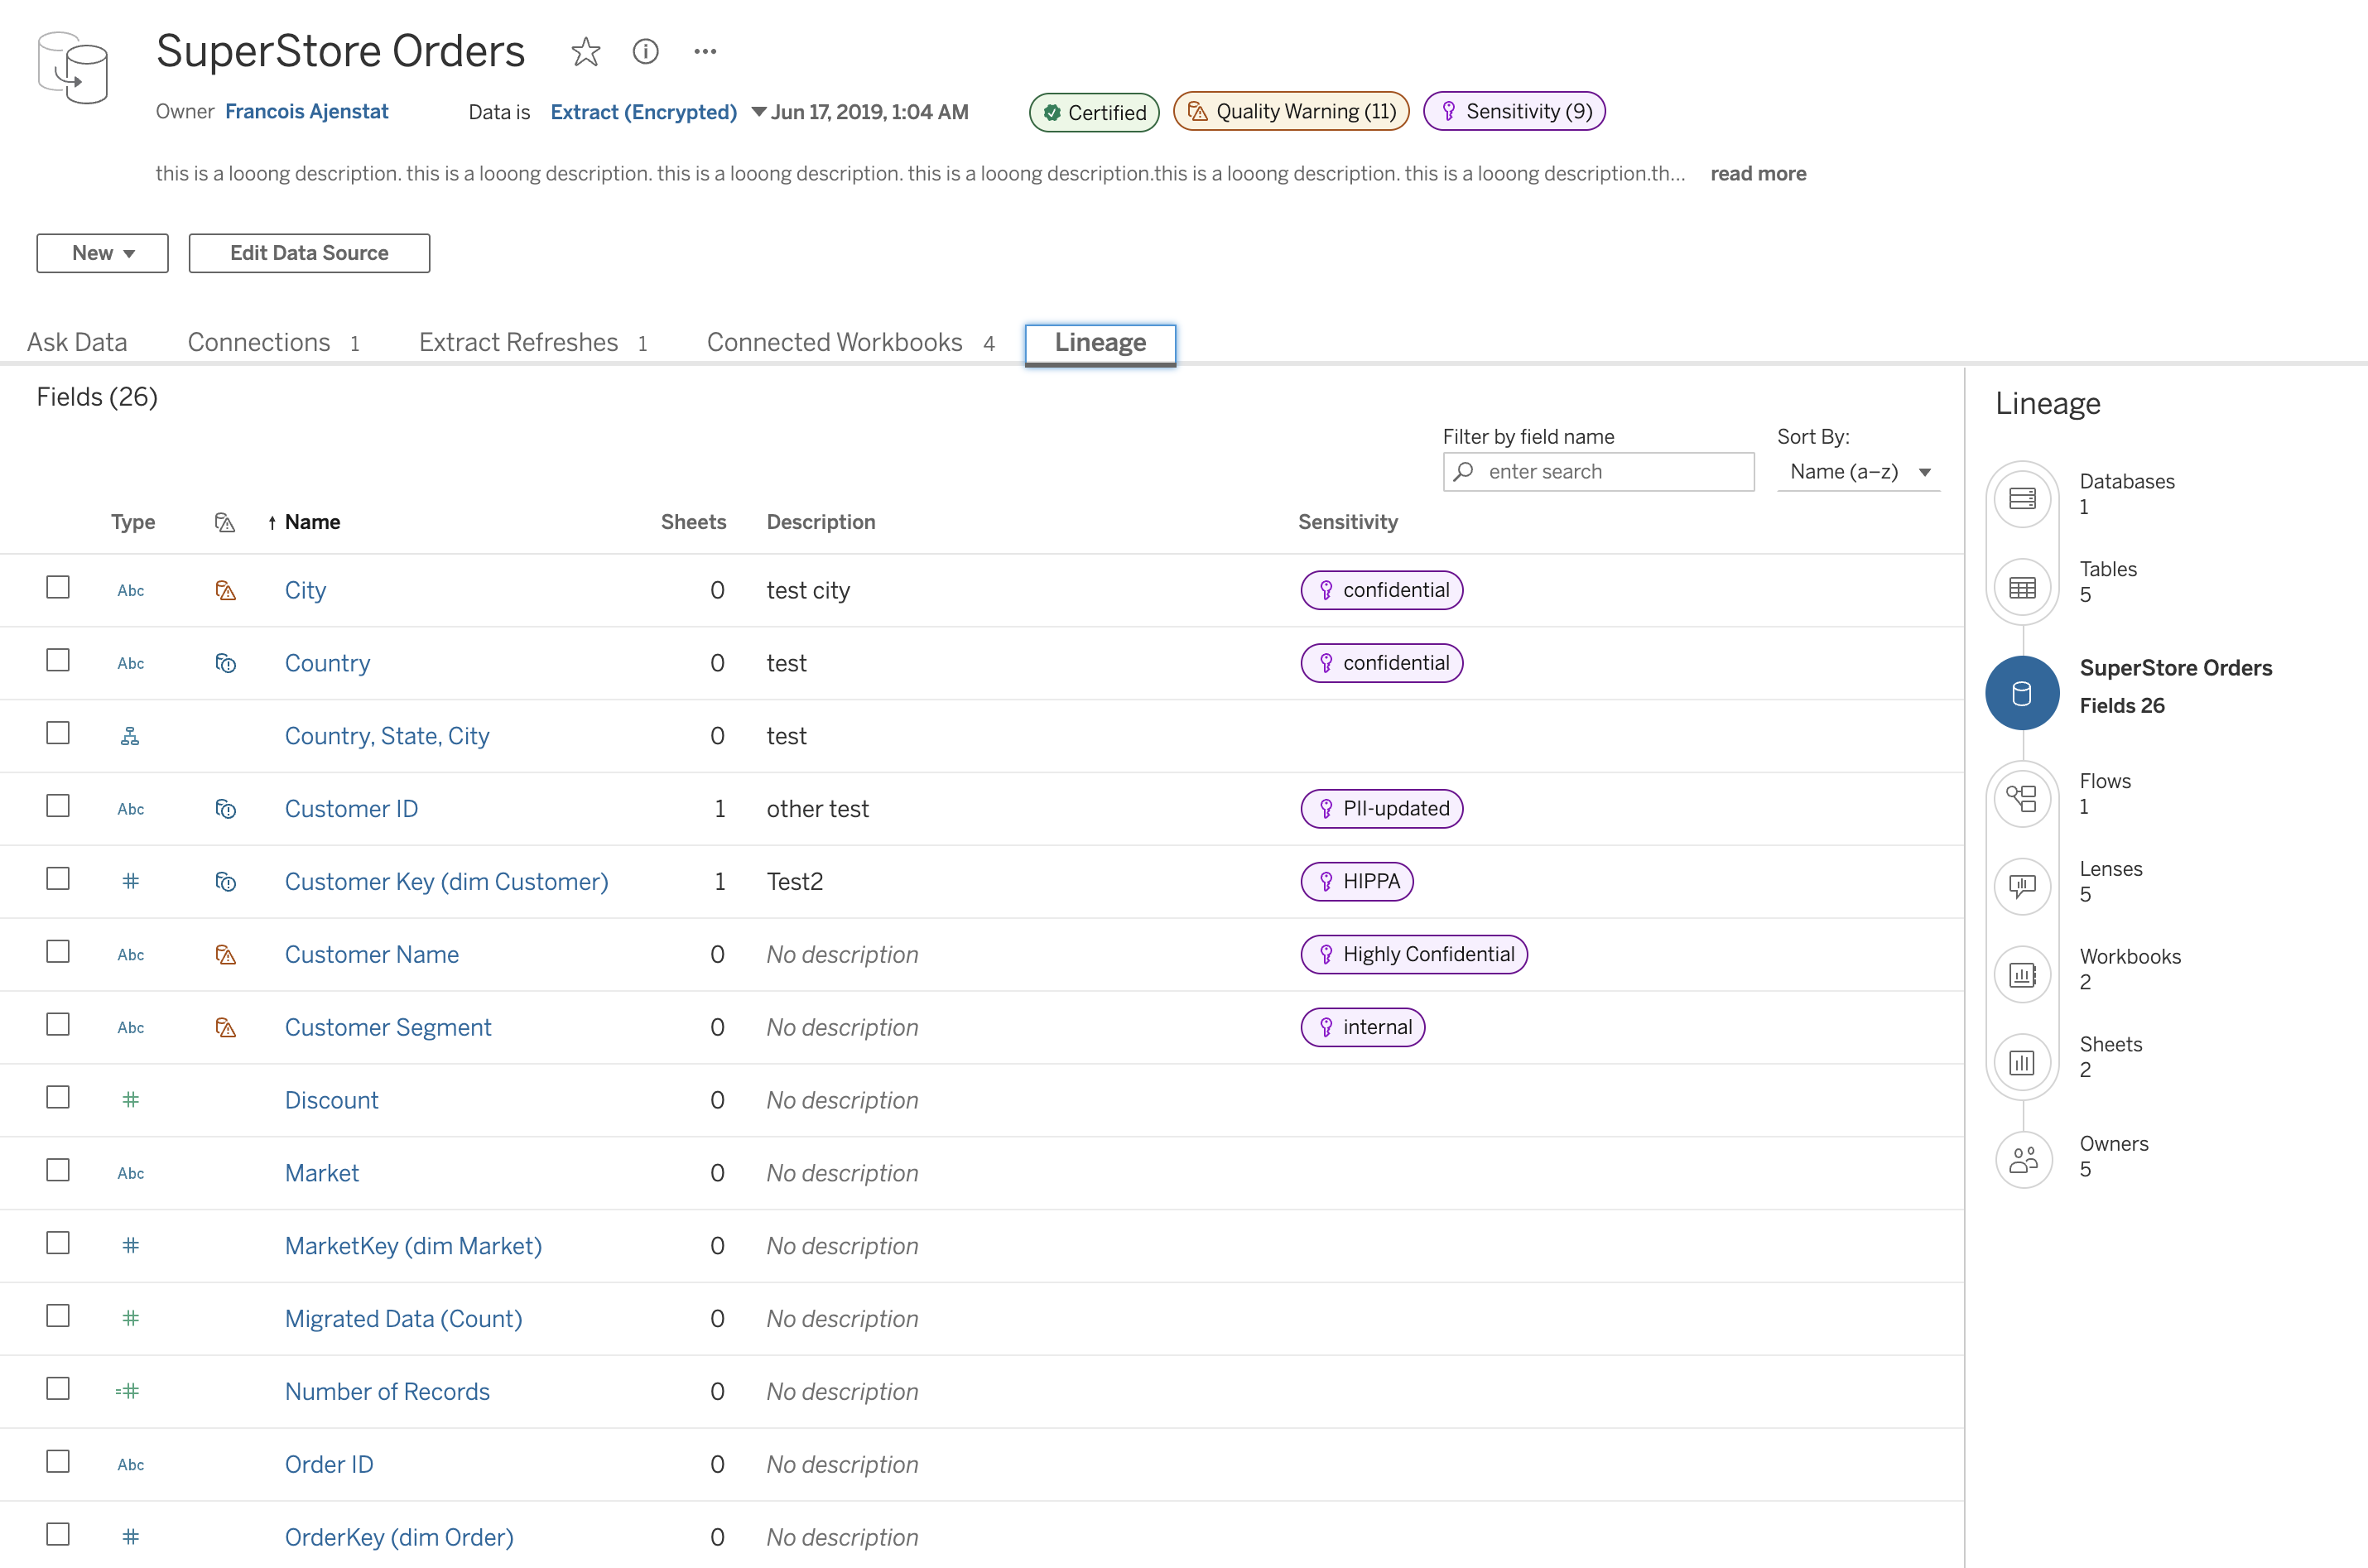
Filter and sort in Lineage
The Lineage page now has a search option to find a field of interest. There is also the option to sort by the number of downstream sheets. Both of these capabilities are especially useful when you have a large numbers of workbooks and data sources and either want to quickly find a field of interest or identify fields that are used the most and proceed with the impact analysis for any potential changes to these fields.
Omnibox integration with mixed content search
Omnibox is a dialog that provides a set of quick search functionalities including recent search terms and content suggestions. To improve the data discovery experience, omnibox has been integrated into the connect-to dialog, the entry dialog for users to search and connect to datasets. Users now can resume search history from auto-suggested recent search terms on the connect-to dialog. Content suggestions offer a one-click connection on target datasets rather than going through the whole search cycle.

Custom scheduling REST API methods
Leverage the new REST API custom scheduling methods to schedule your refreshes and subscriptions in Tableau Cloud. Custom scheduling was previously only supported via the UI but now with API support, you can better support third party workflows, scripts, and automation for your scheduling needs. This feature supports creating, reading, updating and deleting scheduled content.
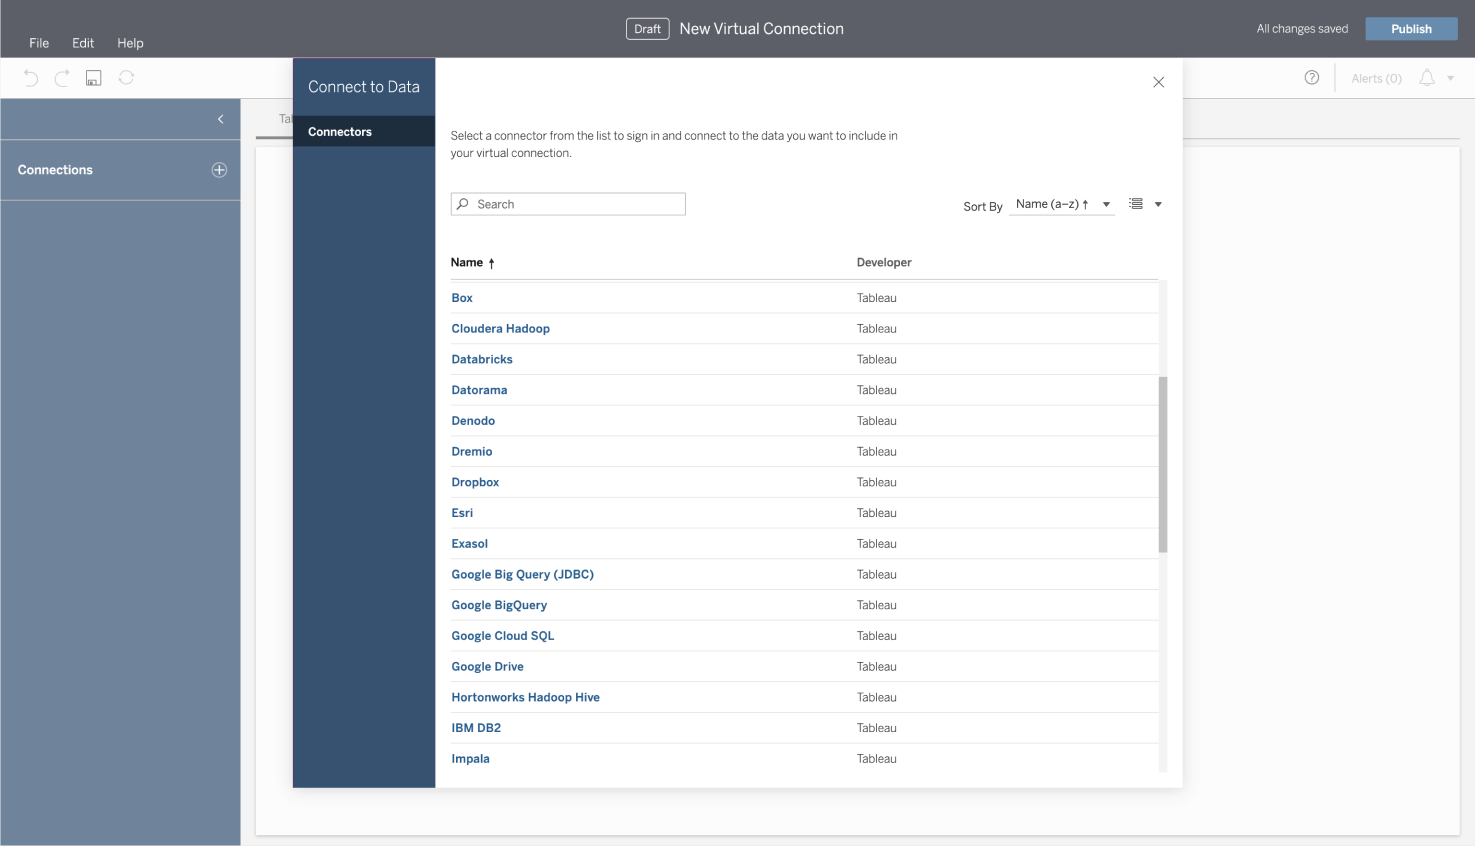
Virtual Connections: additional connector support
Virtual Connections now support connections to:
- Dremio
- Cloudera Hadoop
- IBM DB2
- Kyvos
- Qubole Presto
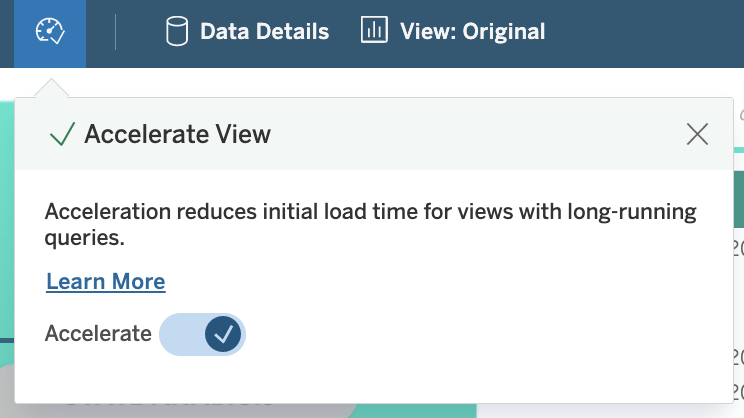
Virtual Connections: View Acceleration support
Workbooks created from data sources leveraging Virtual Connections now support View Acceleration. View Acceleration loads views faster by precomputing and fetching the workbook's data in a background process.
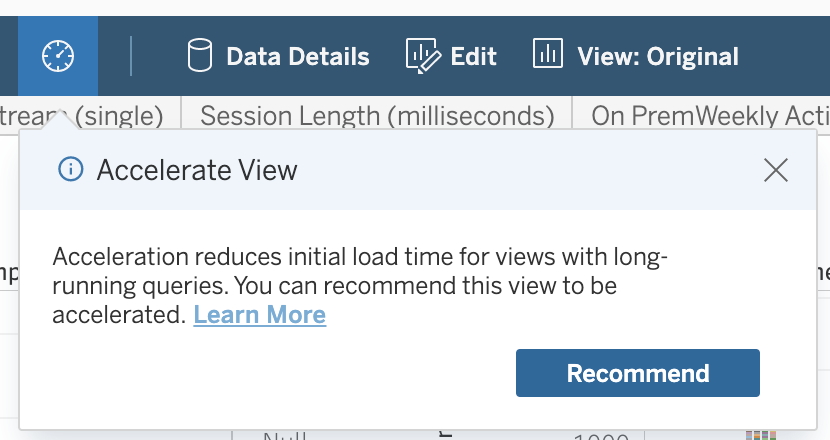
View Acceleration recommendation enhancement
Viewers can now recommend views for acceleration to workbook owners and admins. In addition to workbook query time and usage factors, viewer suggestions are now inputs of the automated view acceleration recommendation service.
Timestamp Tableau Prep outputs
You can now add a dynamic date, or datetime, stamp to Tableau Prep output names. For published data sources and file outputs, Tableau Prep can dynamically update the timestamp when the flow is ran via Tableau Prep Builder or Tableau Prep Conductor. This means you will no longer have to manually enter parameter values.
Admin Insights enhancements
Enhancements include:
- The Job Performance data source now includes Tableau Bridge extract refresh job data. This enables you to better track your Tableau Bridge extract jobs and includes data on your agents, pools, run times, and error messages.
- The TS Users data source now tracks your organization's Tableau Desktop usage.
- The brand new Subscriptions data source lets you see which users have subscriptions and allows you to create a complete picture of subscription health in your deployment when combined with other Admin Insights data sources.
Tableau Catalog: sensitivity labels
You can now label your Tableau assets: databases, tables, columns, data sources, virtual connections, and flows as sensitive. With asset labels you can choose a generic value or create your own depending on how your organization classifies sensitive data. Labeling sensitive data will help guide decision making for users that are shaping, publishing, viewing, or governing data in Tableau. This feature was built API first, so no matter where you store sensitive information today, you can import them into Tableau.
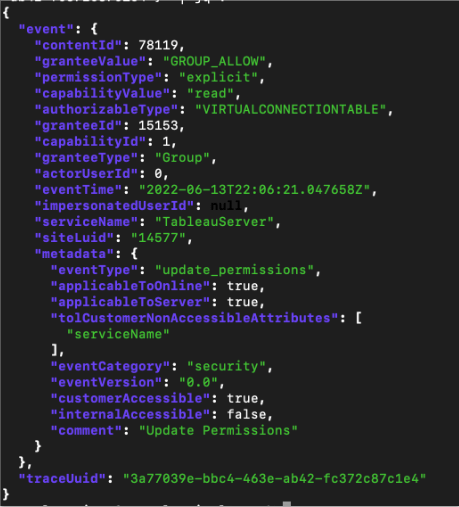
Activity Log enhancements
The Activity Log now provides even more visibility into what's happening in your Tableau Cloud site at near real-time. The Activity Log now tracks:
- Usage of personal access tokens
- Login activities
- Views for workbooks and data sources
Copy paste protection on Mobile
Admins can now protect sensitive data leakage from Tableau Mobile by disabling copy and paste via clipboard on iOS and Android devices.
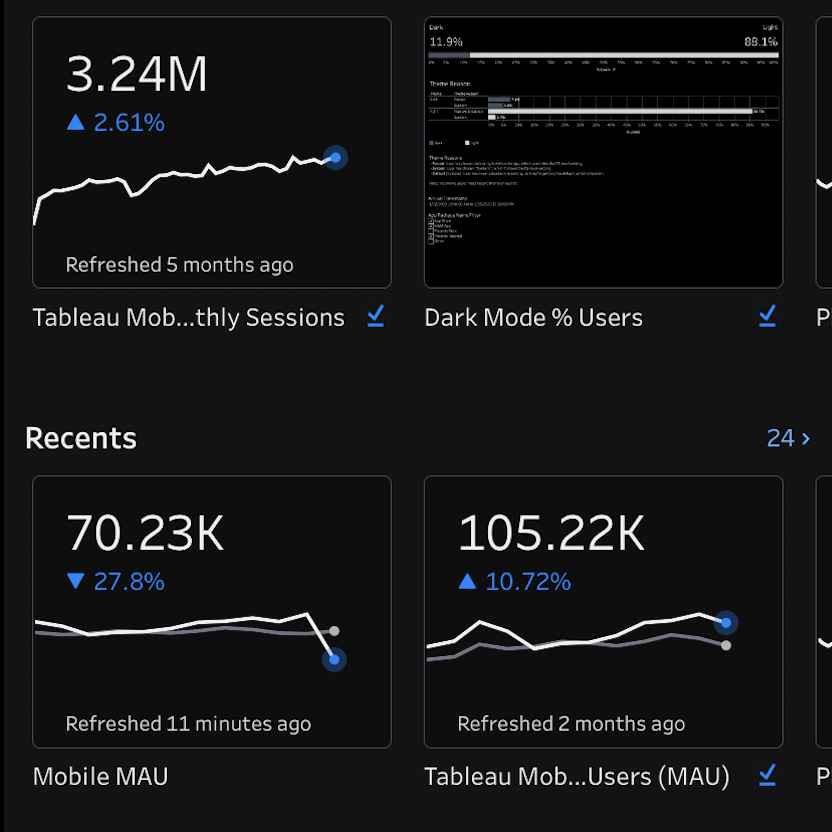
Dark mode on Mobile
Dark mode is now available on Tableau Mobile, providing more flexibility for how you view your data while on the go. Tableau Mobile will respect your device settings by default, or you can configure dark mode through the app's settings.
Embedding API v3.6
The Embedded API v3.6 enables developers to bring self-service analytics to end-users. The API allow you to create an embedded authoring session with a blank workbook. Developers can now programmatically export their embedded dashboard, worksheet or story to CSV, Excel, PDF or PowerPoint without showing Tableau UI. The Embedded API v3.6 also enables developers to handle errors in their external applications when the Tableau connected apps flow is failing.
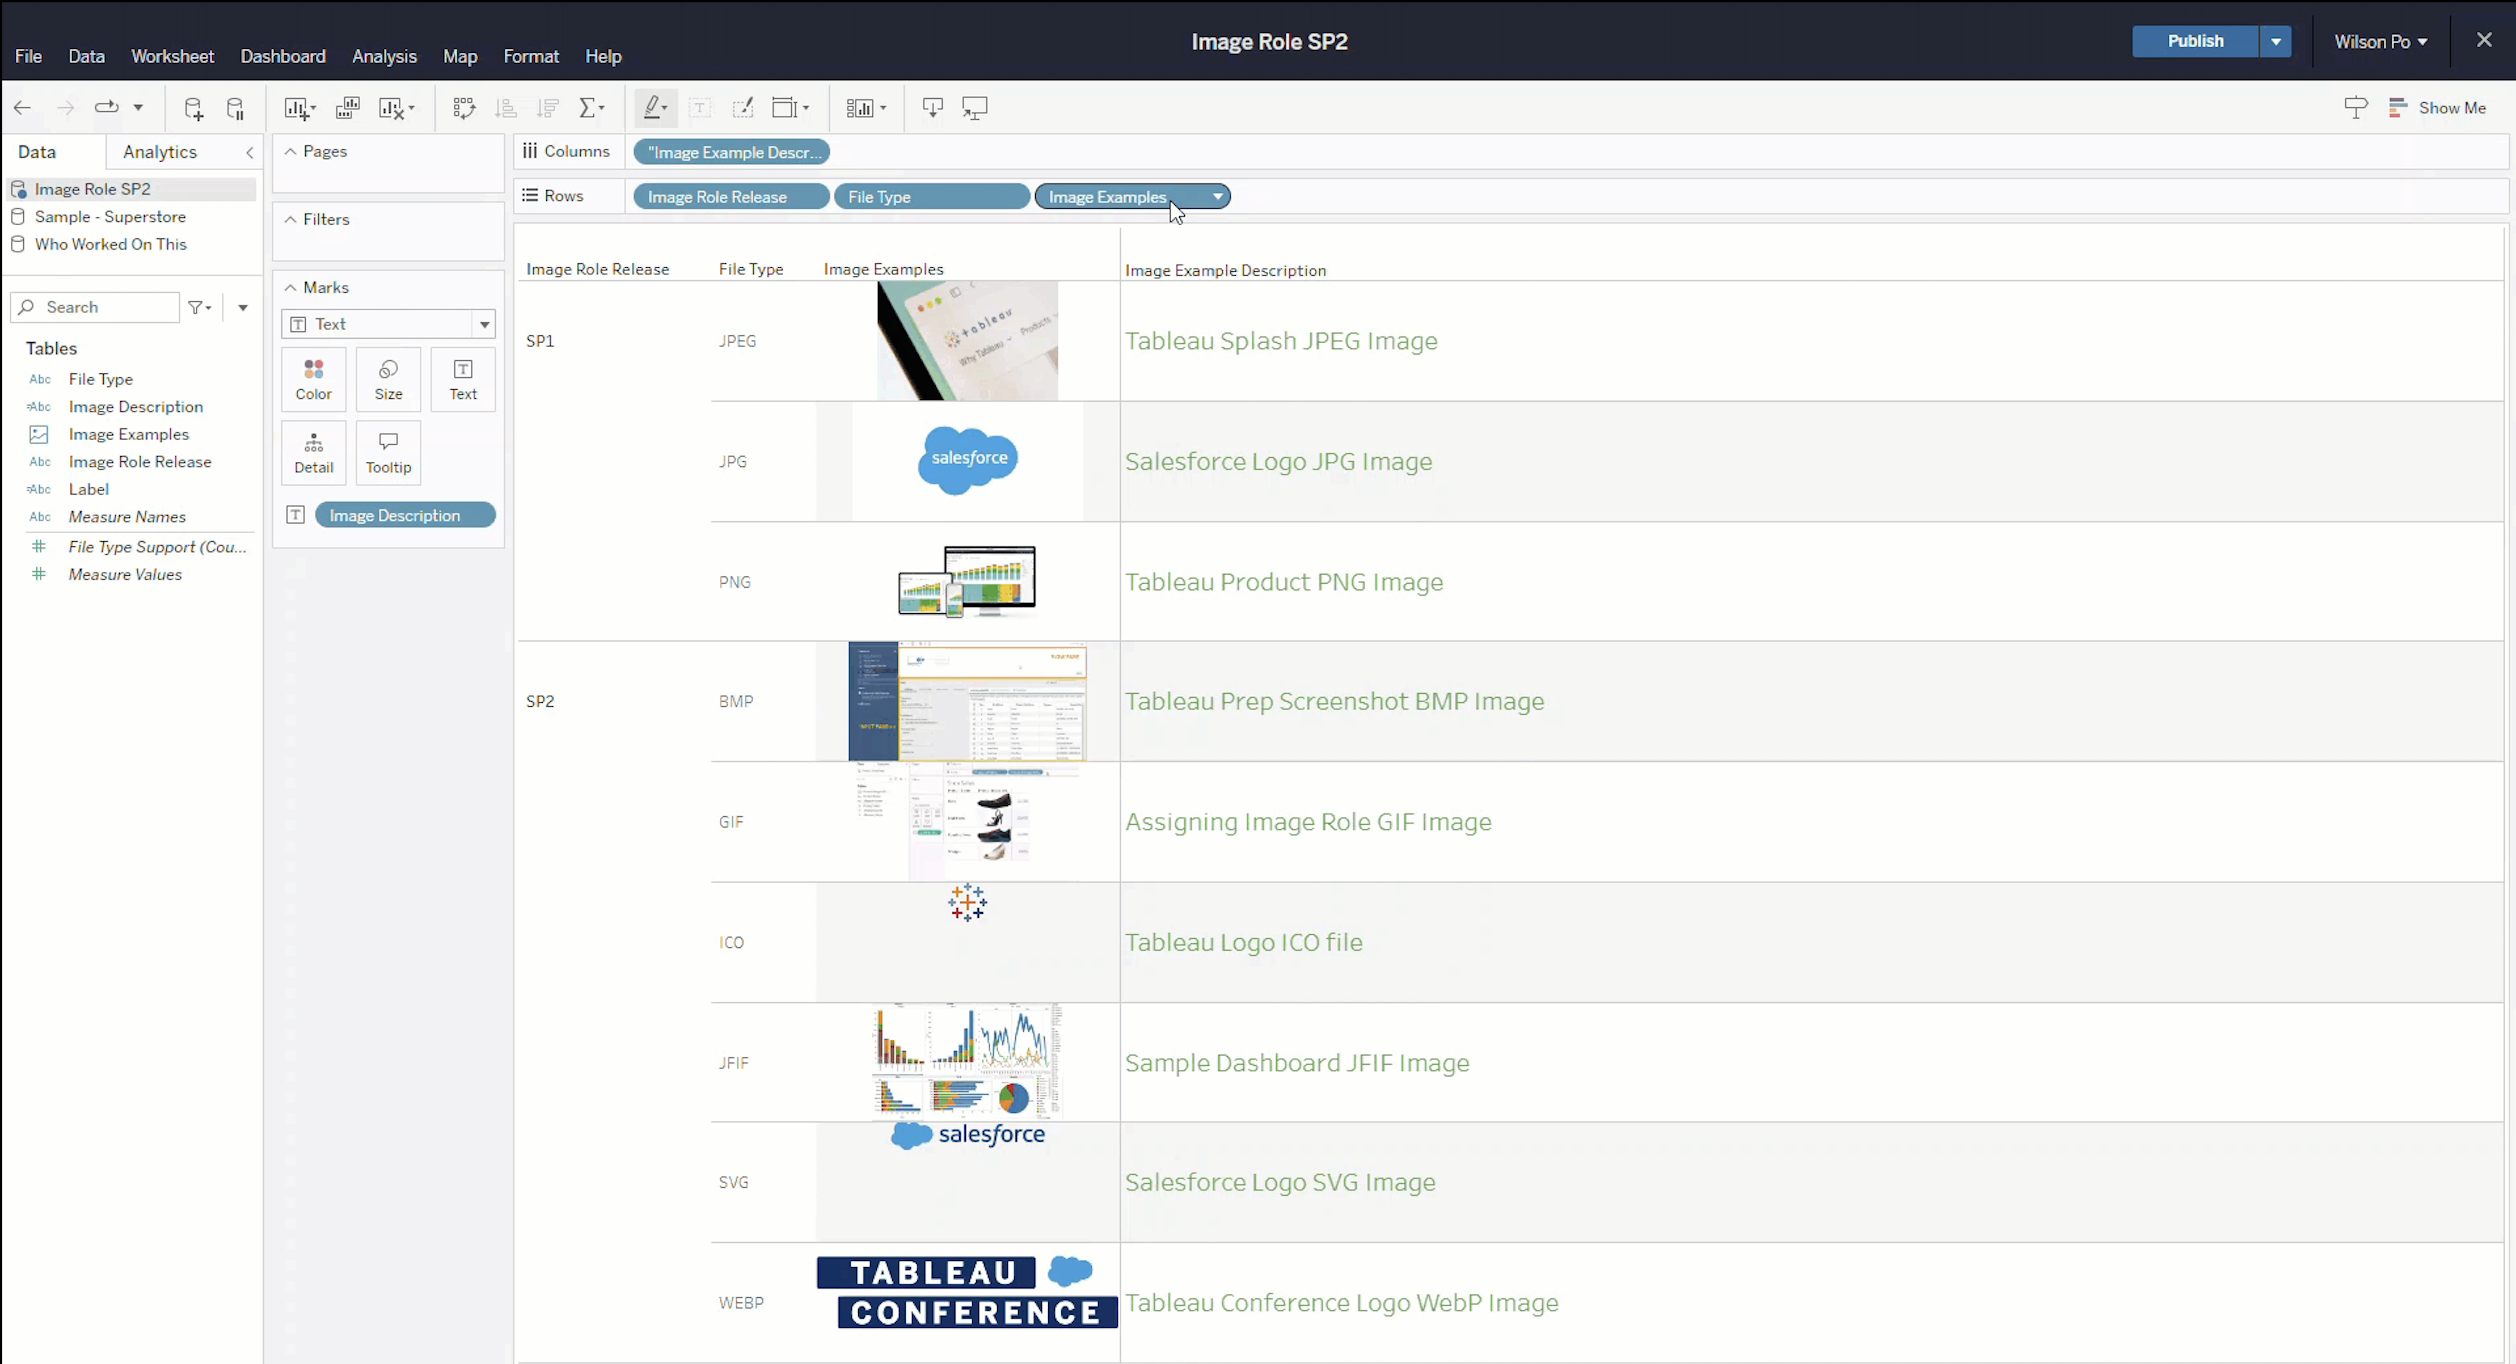
Image Role enhancements
Image Role is easier and more flexible with the recent enhancements. Image Role has expanded image file type support, now including those in SVG, WEBP, JFIF, ICO, BMP, and GIF format in addition to images in PNG, JPG, and JPEG format. Image Role can also now handle up to 100 images per column and increased image fetching to allow images up to 200kb. You can also access the Remove requirement with no need for Image Links to contain extensions.
Data Driven Alert REST API
Our new REST API endpoint enables you to create Data Driven Alerts for visualizations with a single axis. Now you can programmatically create data-driven alerts so key people are notified in their email, Tableau site, and connected Slack workspaces when data reaches thresholds.
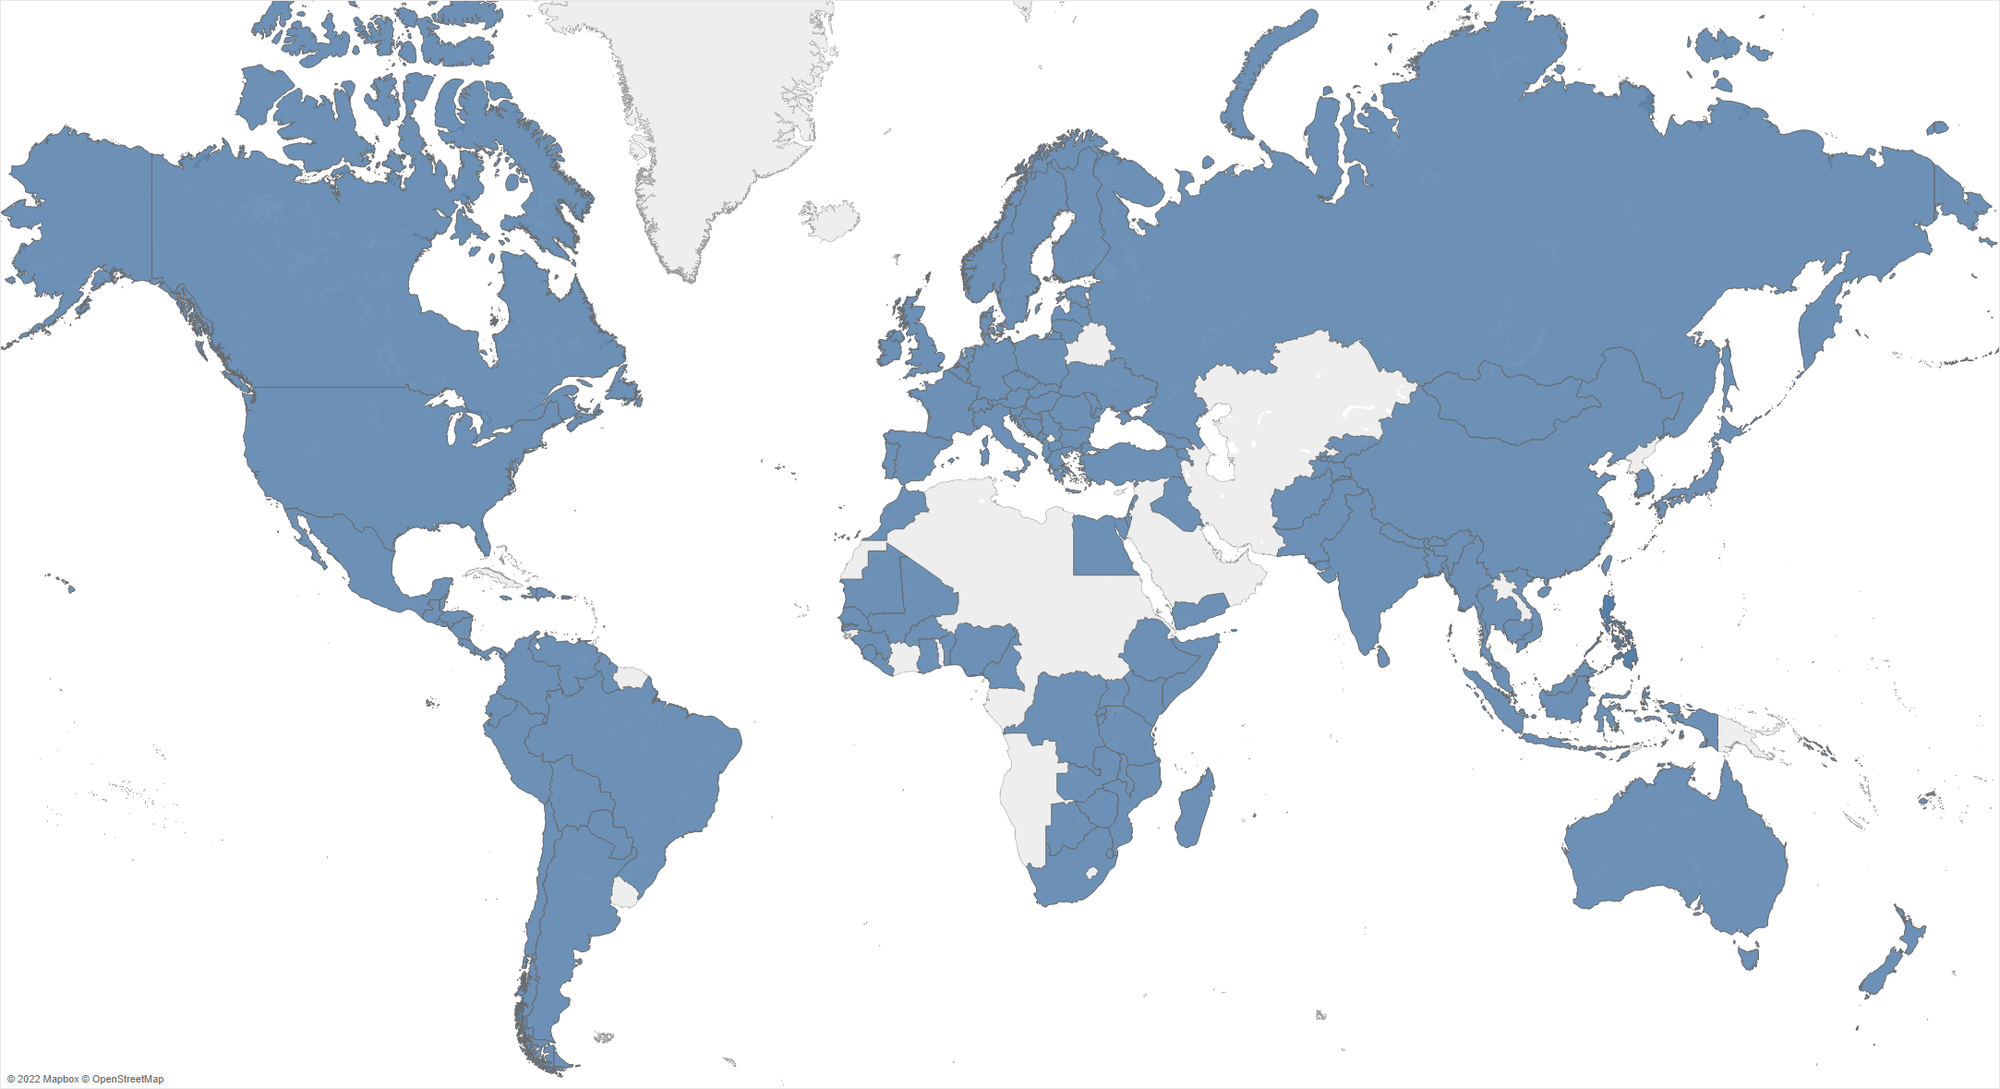
Geospatial analysis enhancements
Geospatial analysis with Tableau is more comprehensive than ever. New enhancements to the spatial calculation language allows you to answer a broad range of questions from your geospatial data. Outline creates new formatting options, ShapeType enables new pivots based on geometry type (e.g. distinct treatments of roads vs. regions), and Length creates new opportunities for route planning. We've also made it easier to bring spatial geometries into Tableau by supporting the full GeoJSON language during import.
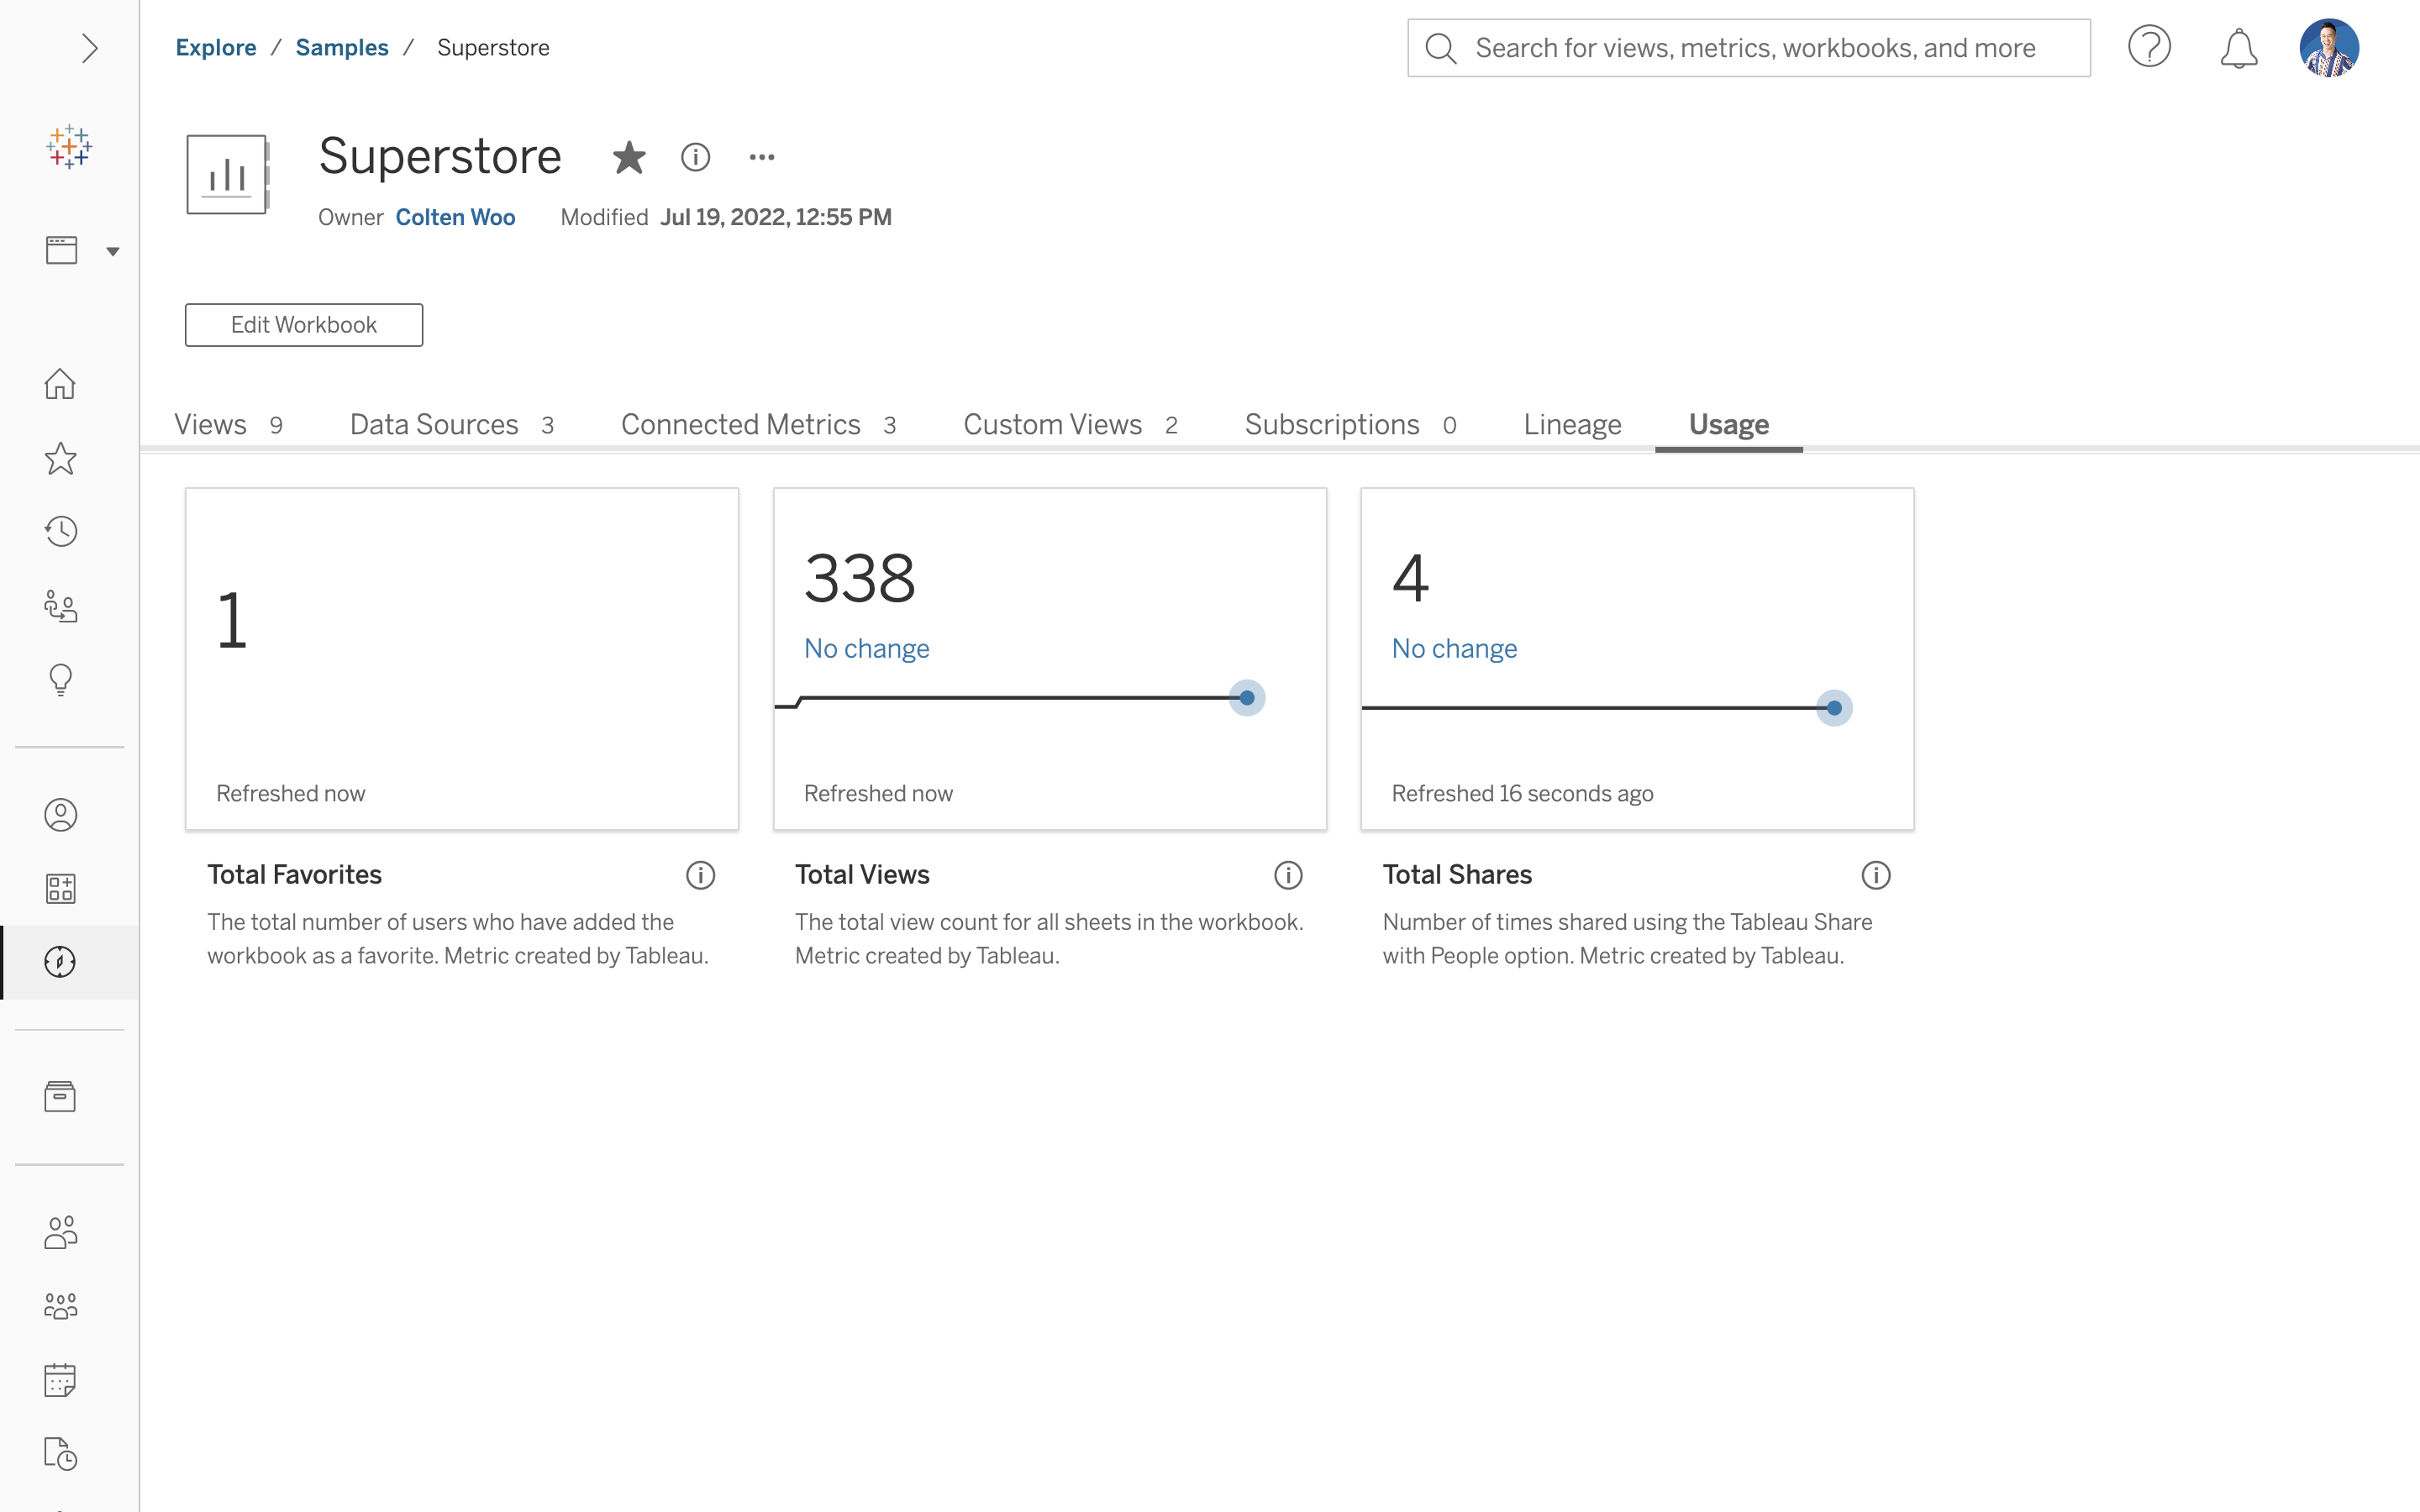
Usage Metrics enhancements
Total shares is now displayed as a Metric in the Usage tab along with total favorites and total views. With these insights, analysts can better understand engagement so they can build content that resonates with their audience. Viewers can leverage Usage Metrics to validate that the content is widely used and trustworthy.
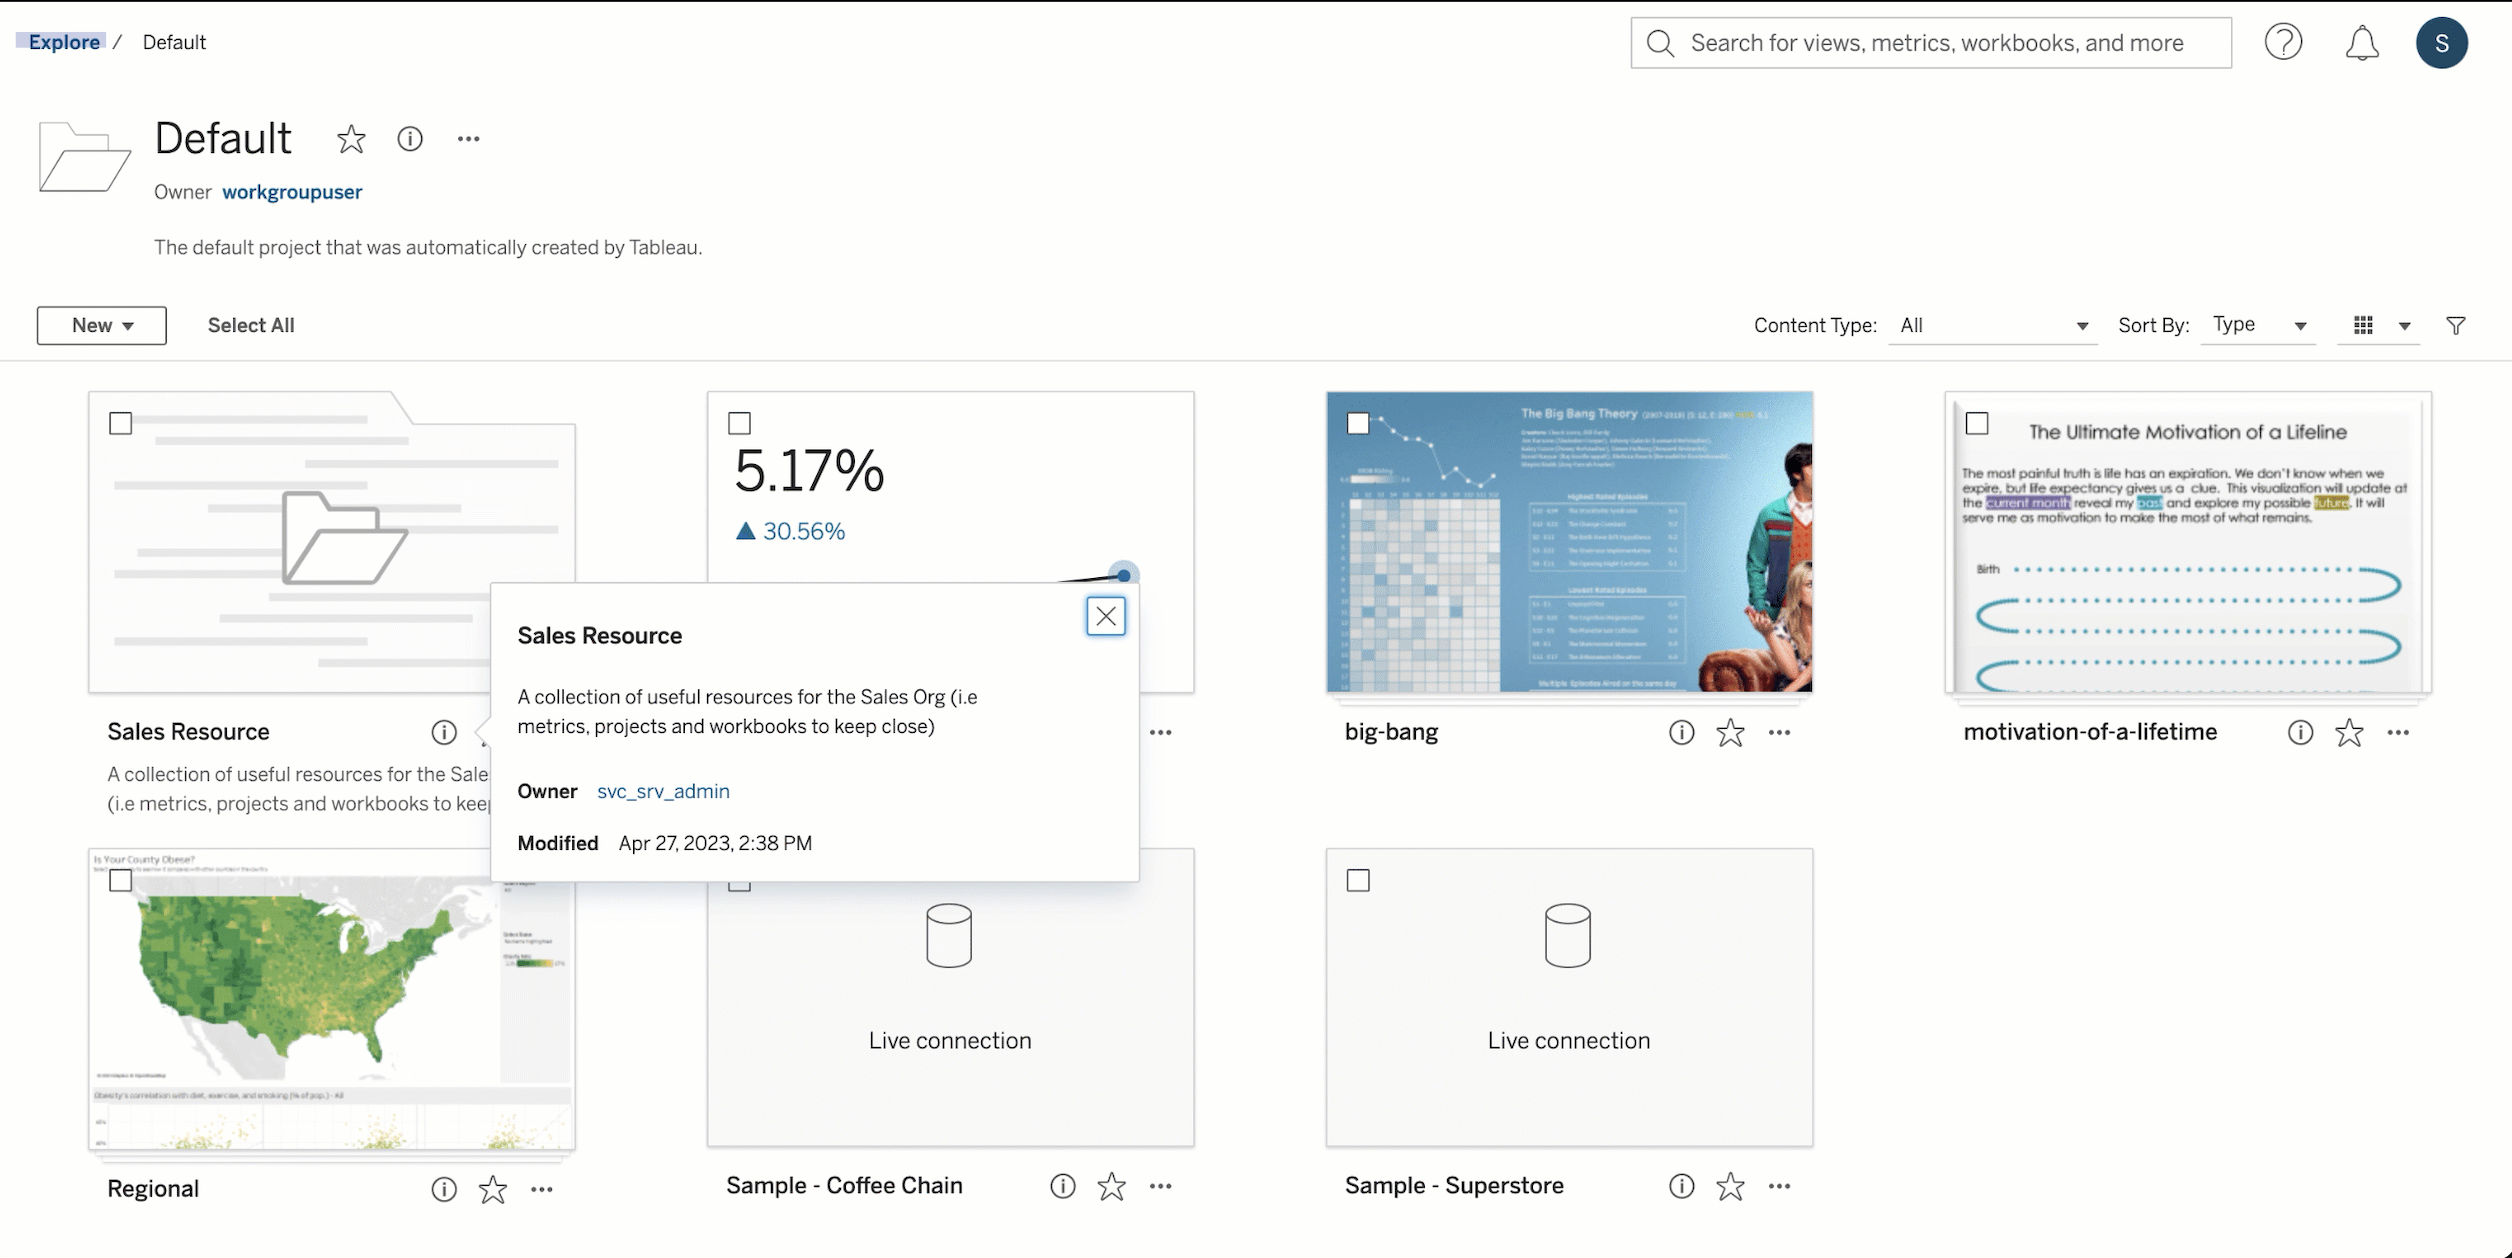
Card navigation improvements
We've made navigating the content grid view more accessible by adding full keyboard navigation support, including selection and batch actions.The focus indicator has also been improved, so you can better understand which item you're interacting with or navigating to. Content metadata is also easier to access via a popover widget.
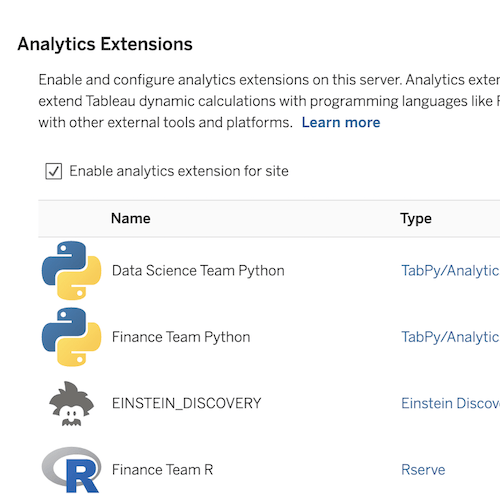
Analytics Extensions enhancement
Now you can compress requests sent to and responses from your Analytics Extension server. This will help you avoid running into payload constraints when using Table Extensions that involve large datasets. To enable this capability, Analytics Extensions admins can set flag 'gzip_enabled' to True.
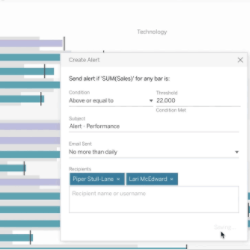
Tableau Cloud email customization
Customize emails by enabling or disabling links in Subscriptions and Data Driven Alerts emails in site settings. This capability is especially useful in embedded contexts, where you may want to provide a white-label experience and drive usage of your application.
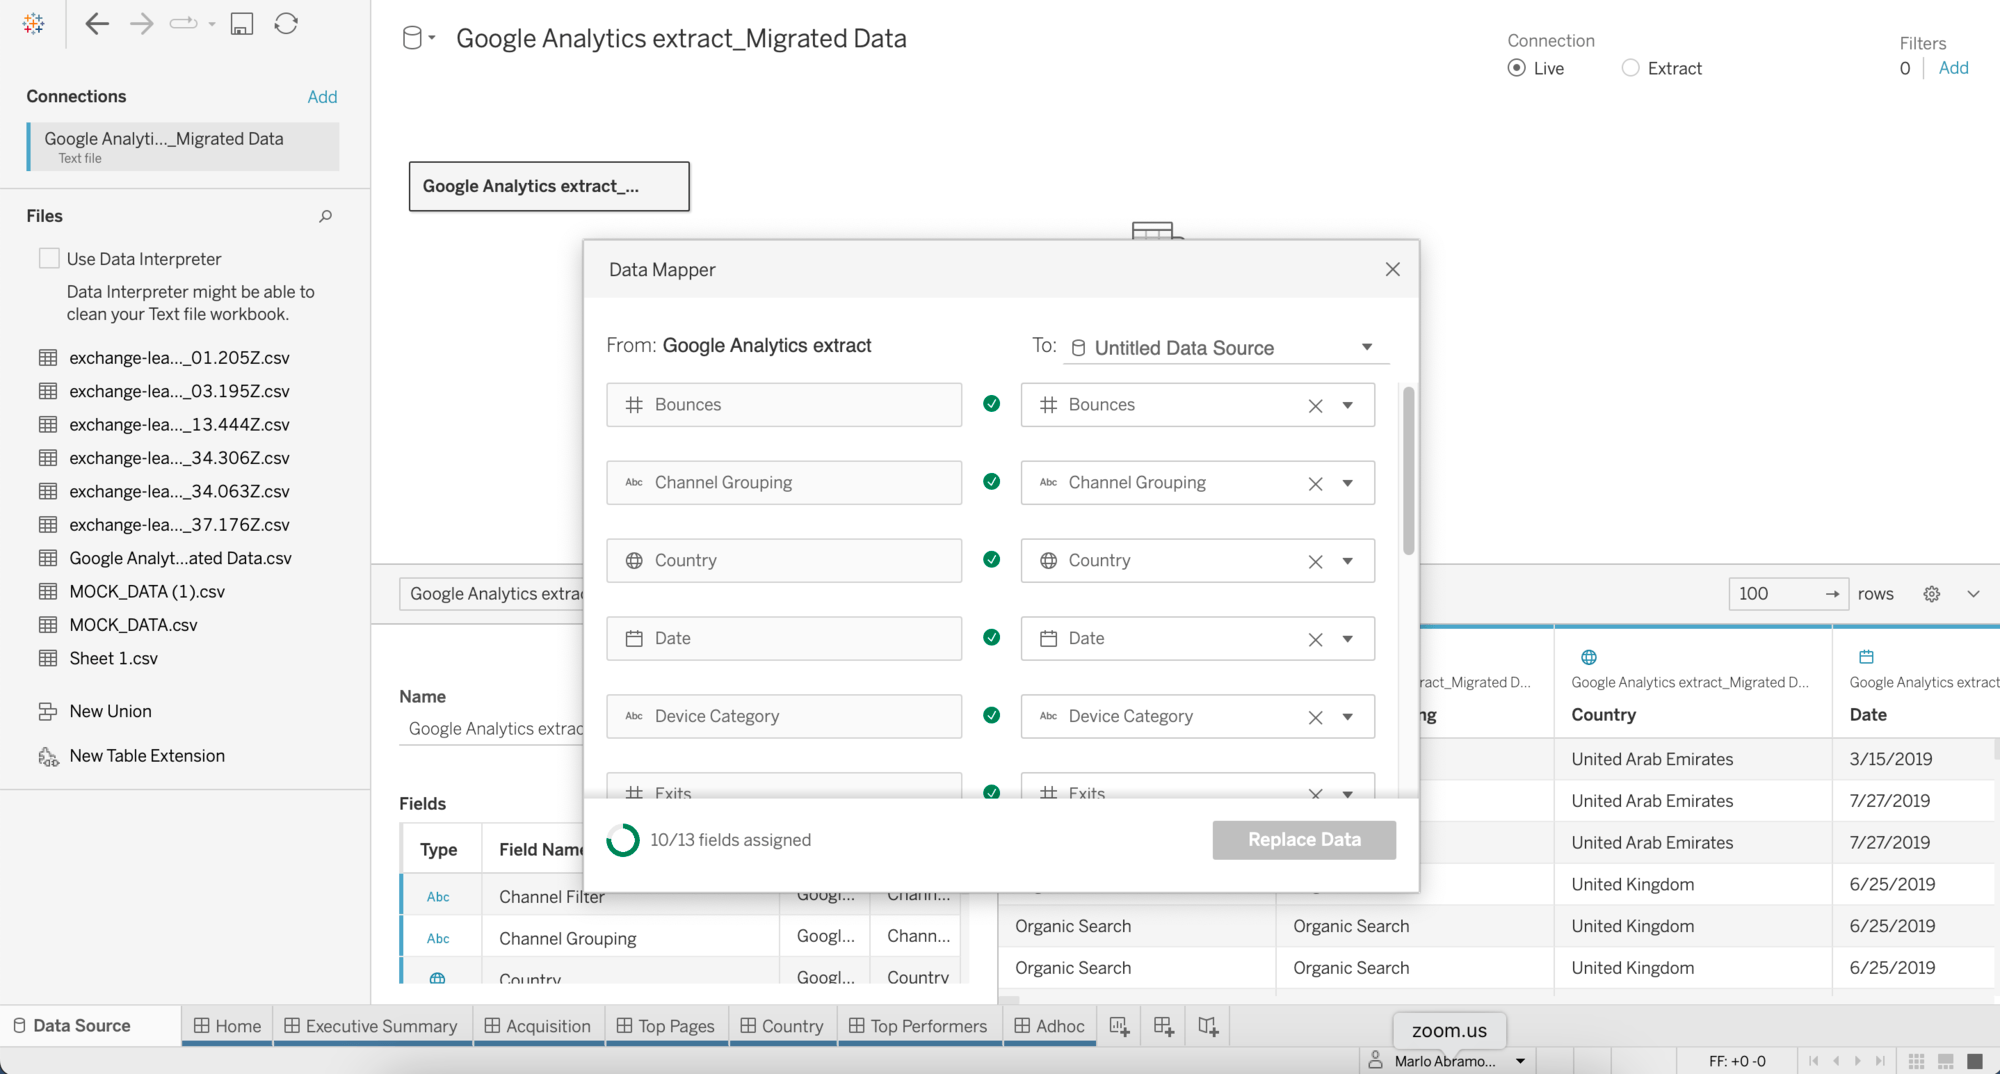
Accelerator Data Mapping enhancements
Data Mapping is now available for all single-datasource Accelerators. With Data Mapping you can jump start your analytics by reducing the time and effort required to set up an Accelerator’s ready-to-use dashboards.
This release brings additional capabilities to Data Mapping including:
- State saving: selected values are retained across multiple sessions
- Sample values: a set of domain values are displayed in the tool tip for the fields
- Switching data sources midway to another data source
- Support for selecting existing connected data sources
Learn More About Tableau Releases